Fellow Traders,
I have no idea, if this method has been posted before and what the long-term stats of success are, but it is fun and has helped me fill the waiting periods inherent to my other systems.
Method
I have no idea, if this method has been posted before and what the long-term stats of success are, but it is fun and has helped me fill the waiting periods inherent to my other systems.
Method
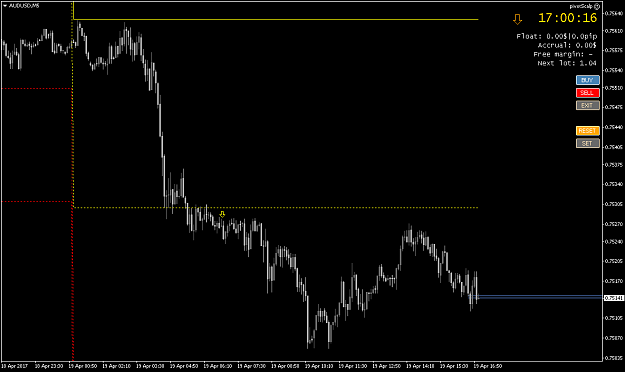
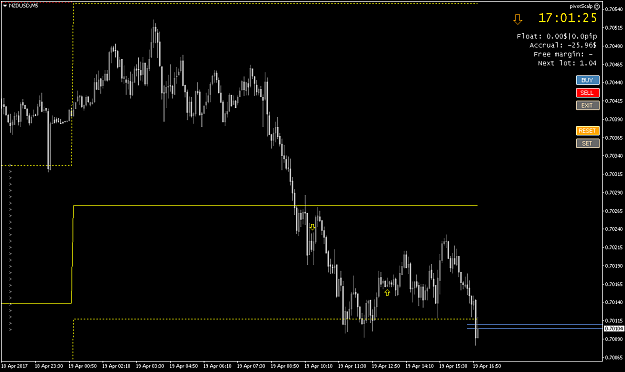
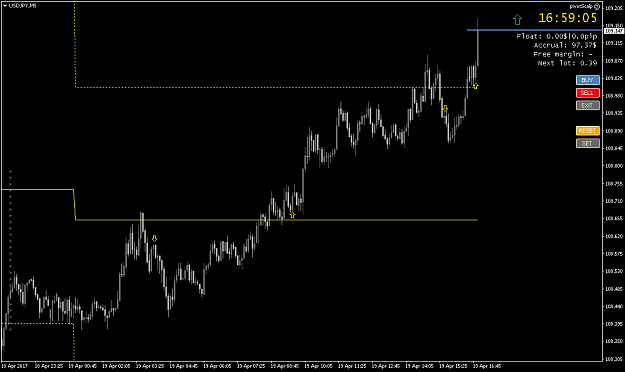
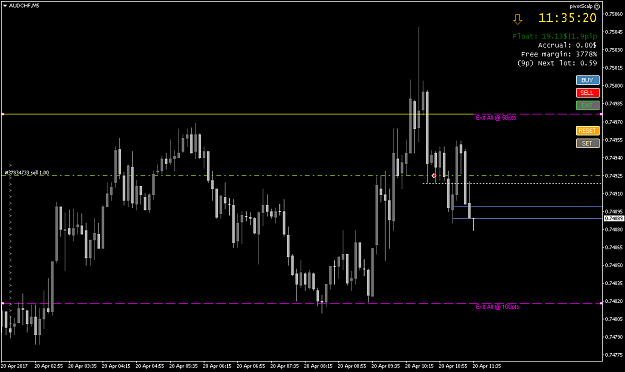
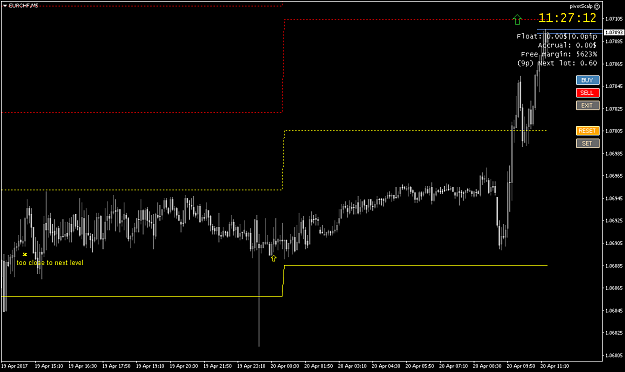
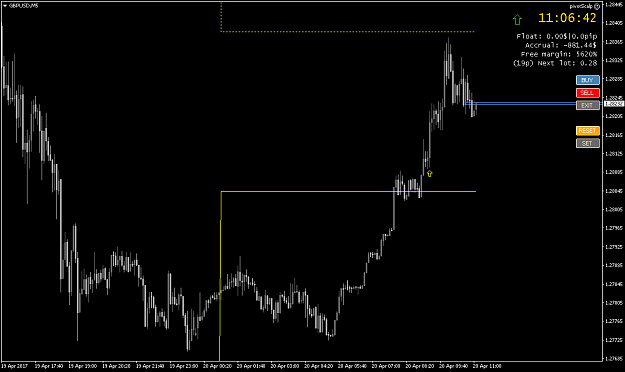
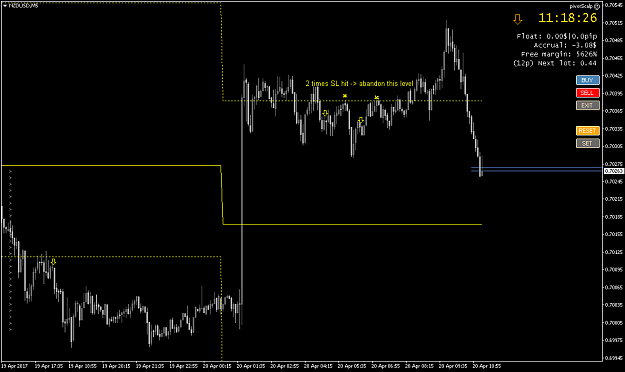
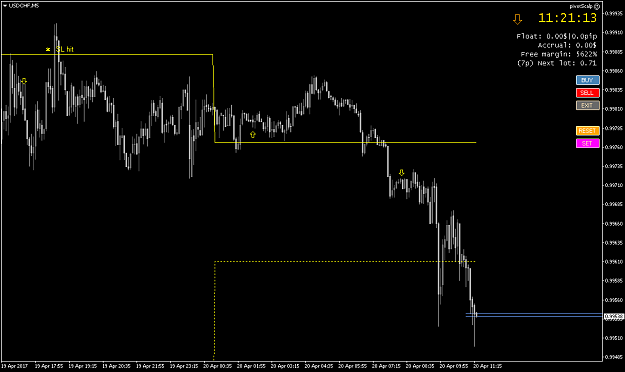
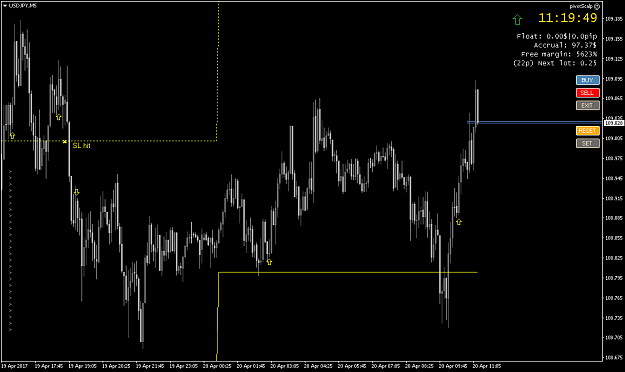
- Open a 5m chart and pick any of the available indicators plotting daily floor trader pivot levels (i.e. P = (H+L+C)/3 calibrated to 5PM NY or 10PM UK).
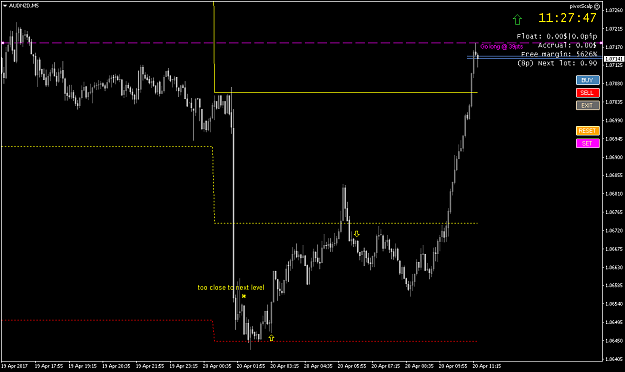
- Wait for price to slice through any of those pivot levels = anchor level.
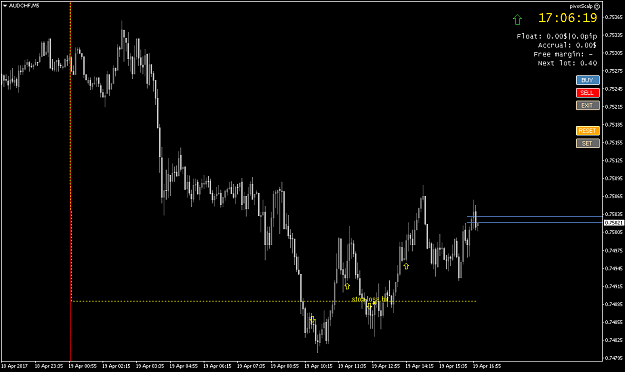
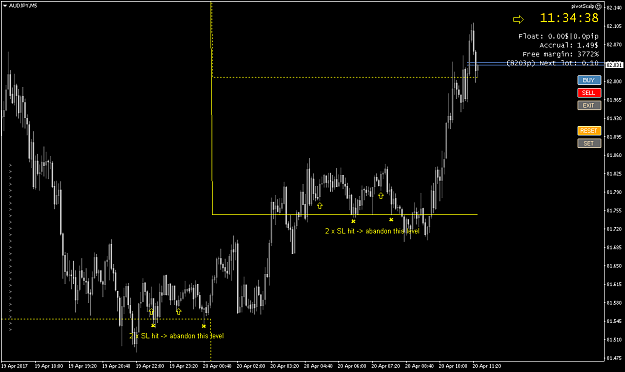
- When the candle low clearly remains above the anchor level (upward move) or the candle high clearly remains below (downward move) wait for a reverse candle - i.e. for an expected upward move wait for a downward candle and place a pending order to buy above it. That pending order is moved downward in case another downward candle plots. This continues as long as the price stays above the anchor level. For expected downward moves the same principle applies.
- The lot sizing is a function of your balance and the distance to the anchor pivot level - e.g. Balance 10,000, distance 5 Pips, Risk 0.5% -> 1 lot
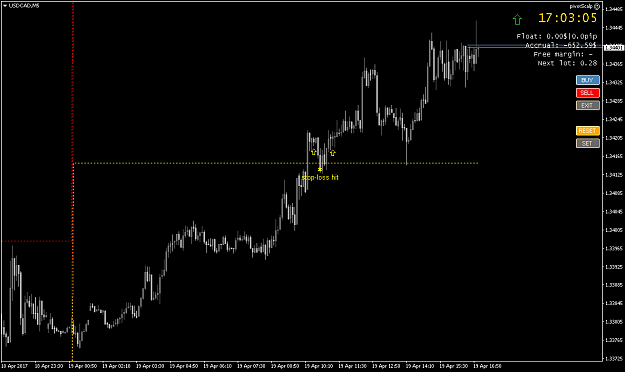
- Place the stop-loss at the anchor pivot level.
- Place the target at 1.5-2 times the stop-loss distance or close manually.
- Enter only once per level crossing - i.e. in case your target got hit or you closed manually, wait for the next setup starting with a level crossing/bounce.
I use this approach on all pairs where median spread+commission<2 pips (I continuously track spreads over 1,000 ticks and calculate median spreads). I keep all those 5m charts open and have an algo running that tracks the prices' proximity to the next respective pivot levels as well as the direction of last level crossing. That helps me focus my action when prices approach levels.
In case you have some long-term stats or experiences, please share.
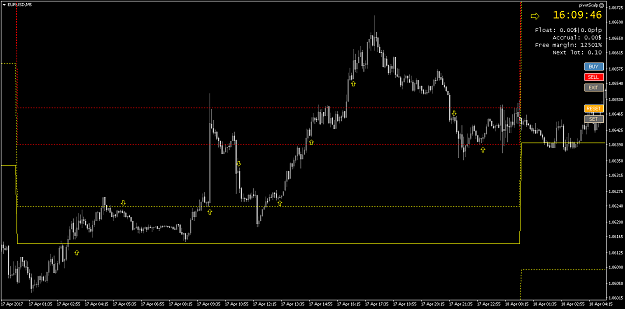
Attached Image (click to enlarge)
Augmenting Intelligence