alright I think the lines are to do with spacing between slow cars? so one will only show when theres a designated amount of space. on the tiger time lane template its set to 15 is this observation correct
AO, sorry to bother. I noticed that on the dark template the l1 and l2s are different to some of the other versions provided why is this? should I be using yours as opposed to the others
{quote} AO, sorry to bother. I noticed that on the dark template the l1 and l2s are different to some of the other versions provided why is this? should I be using yours as opposed to the others
Ignored
On the original older version the SMA cluster for each time frame is {21, 34, 55, 75, 100, 144, 233}
On my last version it's {13, 21, 34, 55, 89, 144, 233}
So minor difference....
|
Joined Aug 2015
|
Status: Learning with the life
|250 Posts
G'afternoon!
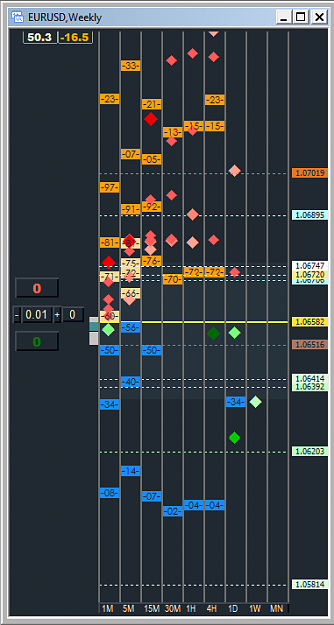
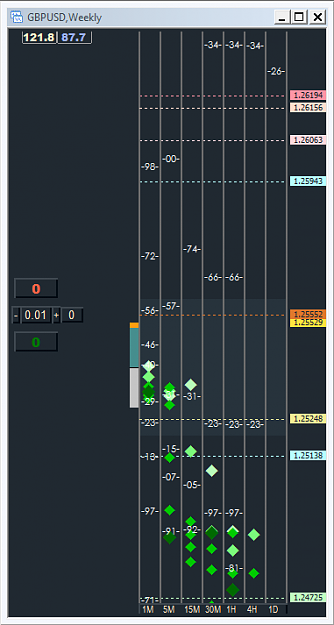
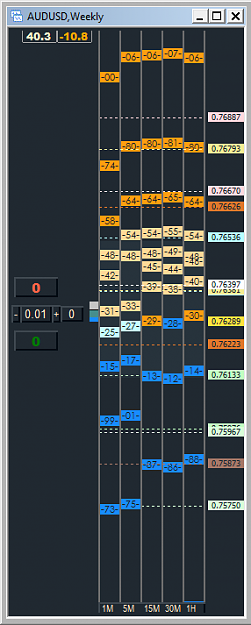
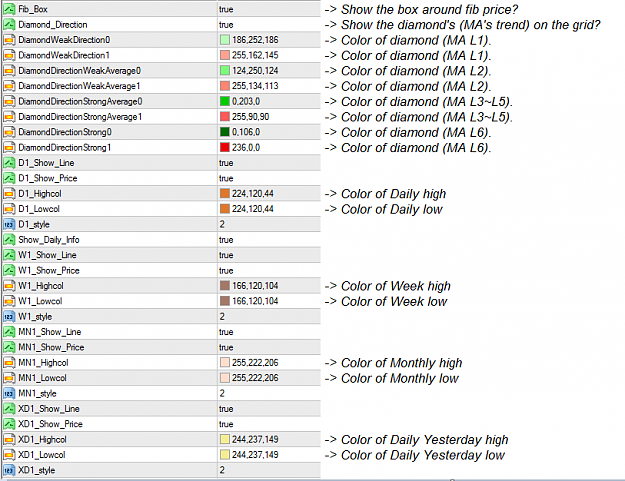
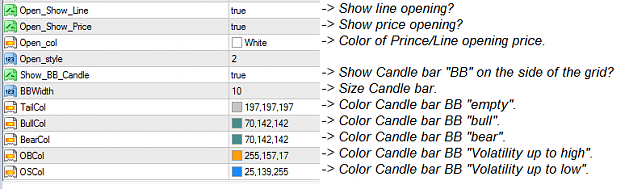
I share with you an "improvement" I made on the new grid (FXPM).
- Thanks to the AO, for giving us this opportunity to know this tool, and have made it available with its open source in order to spread it. - Thanks also to other users who somehow contributed so that I could get where I wanted to get on the grid: *Cornulala *Istvanhlc230 *Retlaw *Sciurus *Superjolt *Dezzy (who presented the model of TFA, which without a doubt is a tool show which I also inspired to create "our FXPM")
- (I apologize if I forgot to mention somebody).
The improved tool below is not "the best", but it's an improvement I made to improve the hit rate and further deepen the project (which was the initial proposal of this topic) I'm not a professional coder and I was not the creator of "GRID", as I mentioned above, the members in question that will help in some way I could gather information, aggregate and adjust in the best of intentions. (Especially the AO, for providing us with this great tool with its open source)
I share with you the new FXPM +++ v4.0.
*Noting that the weekly and monthly pivot points are made upon the fibonacci calculation, the daily pivot point is already done on top of the simple pivot calculation.
Attached Image (click to enlarge)
Attached Image (click to enlarge)
Attached Image (click to enlarge)
Attached Image (click to enlarge)
Attached Image (click to enlarge)
Attached Image (click to enlarge)
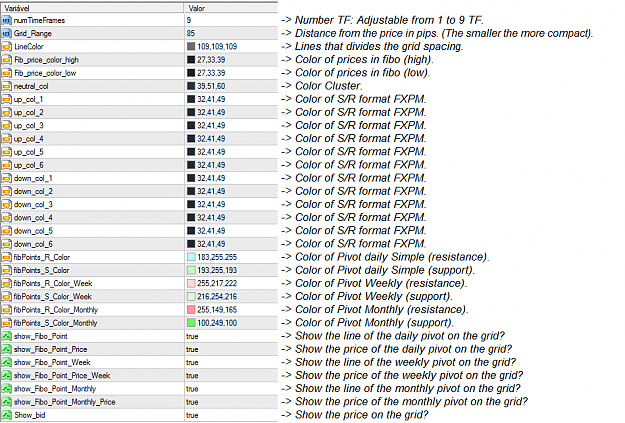
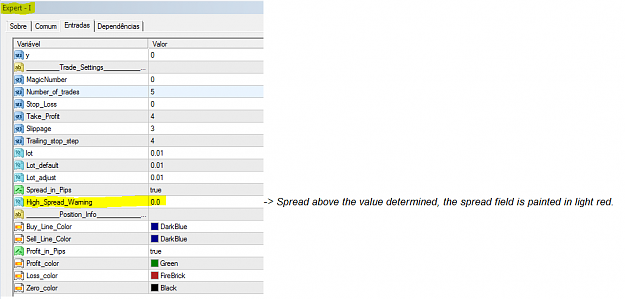
Config in EA.
Attached Image (click to enlarge)
- Make good use of the tool, and feel free to continue with the follow-up, if some professional and more experienced programmer wants to improve it, feel free, the intention here is to improve even more.
- I apologize for the delay and I would like once again to make it clear that I WAS NOT GRID'S DEVELOPER, I just improved to my liking what I got from other members as I mentioned above and I am sharing in order to improve it even more.
@DaniP: your version looks really beautiful, very similar to TFA.
I got one question about the math: Does anybody know whether the TFA really uses the fiblevels in the same way as this indicator?
Usually, I would define fiblevels as percentage retracement from highs/lows, but if I understand it correctly, the indicator just uses constant distances from various moving averages in points with these fibo distances : 10, 16, 26, 42, 68, 111, 179, 290, 470, 760, ...
I don't really see how to justify the importance of those distances. With fib retracements one could argue than many big players also look at those levels, but who is really monitoring the 179 point distance to any moving average?
So in the end it is just a visual feedback of how far the currency pair has traveled on different time scales rather than any connection to fiblevels. Am I wrong?
{quote} Either you have the wrong information or you are lying. He is definitely not the creator of TFA or i'm must be schizophrenic
Ignored
He presented the TFA in the SH and here in the FF, and once made available the TFA in the SH for a few days for testing. (To the EU)
Then by the way he said I figured he was the TFA programmer and one of the commanders.
@DaniP: your version looks really beautiful, very similar to TFA. I got one question about the math: Does anybody know whether the TFA really uses the fiblevels in the same way as this indicator? Usually, I would define fiblevels as percentage retracement from highs/lows, but if I understand it correctly, the indicator just uses constant distances from various moving averages in points with these fibo distances : 10, 16, 26, 42, 68, 111, 179, 290, 470, 760, ... I don't really see how to justify the importance of those distances. With fib retracements...
Ignored
Thank you Cornulala.
- About TFA, I can not tell you how it was made the basis for calculating their fibo levels.
- On fibo levels, the only answer I can get to you more effectively and this below:
{quote}... The distances for the shade levels represent fibonacci sequence, using 10 pips as a base. (10*1.618 = 16 *1.618= 26*1.618 and so on...... and then all numbers are rounded for simplicity) Then for each time frame the upper levels are projected starting from the lowest MA in the cluster, and the lower levels are projected from the highest MA. The yellow range zone is created by the first overlapping distances. For example if 10+10 are not overlapping it switches to 16+16 and so on.....
...Usually, I would define fiblevels as percentage retracement from highs/lows. With fib retracements one could argue than many big players also look at those levels, but who is really monitoring the 179 point distance to any moving average? So in the end it is just a visual feedback of how far the currency pair has traveled on different time scales rather than any connection to fiblevels. Am I wrong?
Ignored
I found it very interesting to be able to add the levels of fibonacci retracement, on what basis could we increase them in FXPM?
Yes adding fibo retracements would be great. I've written an indicator for that in java. When I have some time, I could try to translate. The would be as followed for buy retracements. Sell retracement would be the same just reversed.
1. Define what a local minimum is. For example, lowest value within +-2 bars low[i] = min(low[-2], ...., low[i+2]).
2. Take the lowest local minimum as our base value. We need the local minima first because else the lowest minimum could be our starting point since we can only go a certain time in history.
3. Search for the highest maximum, which comes AFTER that minimum in time. Just a normal for loop for bars after the lowest minimum.
4. retracementLevelsBuy[k] = maxAfterLowestMin - retracementFractions[k] * (maxAfterLowestMin - lowestLocalMin). Where we could for example use an array with 4 retracementFractions = [0.382, 0.5, 0.612, 1.]
This does not depend much on time frame but more on the total time of the history we search through. So for example one could use 500 H4 bars, H1 bars and M15 bars, each would give us 4 buy and 4 sell levels. Not sure when I'll find the time to implement it, could take a while, but maybe someone else is inspired.
Ok. Here he has an other nick than at SH, apologize it. I know him only under that nick Comfy.
But why do you copy his work after he show so much friendliness and shared the model? You even copied his colorscheme here. Good for him that his tool is light years in front compared to the stuff here and I hope his deal he made with a big broker gives him the chance to get the user base he deserves. Should all the beggars, indicator collectors and losers stay with the copied stuff here. Because of so many ungrateful behaving members everyone who has something to share her must think twice about it.
Yes adding fibo retracements would be great. I've written an indicator for that in java. When I have some time, I could try to translate. The would be as followed for buy retracements. Sell retracement would be the same just reversed. 1. Define what a local minimum is. For example, lowest value within +-2 bars low = min(low[-2], ...., low[i+2]). 2. Take the lowest local minimum as our base value. We need the local minima first because else the lowest minimum could be our starting point since we can only go a certain time in history. 3. Search...
Ignored
I understand, however, I still do not know how to do it within mql4, but I will go into the idea of adding fib retracements.
Ok. Here he has an other nick than at SH, apologize it. I know him only under that nick Comfy. But why do you copy his work after he show so much friendliness and shared the model? You even copied his colorscheme here. Good for him that his tool is light years in front compared to the stuff here and I hope his deal he made with a big broker gives him the chance to get the user base he deserves. Should all the beggars, indicator collectors and losers stay with the copied stuff here. Because of so many ungrateful behaving members everyone who has something to share her must think twice about it.
I implemented the real Fibonacci retracements into the indicator. See attached files.
I removed the old fib levels because for me it would be too crowded to have all those boxed.
The new fib retracements levels are calculated from look back times of 1 day (1 min period) up to 12 years on monthly chart.
They are labeled 38, 50, 62 and 100 for the corresponding fib retracement and buy retracements are always blue, sell always red no matter if they are above or below the current price. I think that makes more sense with those levels.
The calculation is not perfect, maybe someone has a better way of doing it, I just used the first solution that came to mind.
I think those levels are more relevant than the old ones because Fibonacci retracements are also used by professional traders, but I can't say that I have much experience in trading one or the other.
I implemented the real Fibonacci retracements into the indicator. See attached files. I removed the old fib levels because for me it would be too crowded to have all those boxed. The new fib retracements levels are calculated from look back times of 1 day (1 min period) up to 12 years on monthly chart. They are labeled 38, 50, 62 and 100 for the corresponding fib retracement and buy retracements are always blue, sell always red no matter if they are above or below the current price. I think that makes more sense with those levels. The calculation...
I implemented the real Fibonacci retracements into the indicator. See attached files. I removed the old fib levels because for me it would be too crowded to have all those boxed. The new fib retracements levels are calculated from look back times of 1 day (1 min period) up to 12 years on monthly chart. They are labeled 38, 50, 62 and 100 for the corresponding fib retracement and buy retracements are always blue, sell always red no matter if they are above or below the current price. I think that makes more sense with those levels. The calculation...
Ignored
This is really good, you are improving the indicator a lot. Thanks for your work!