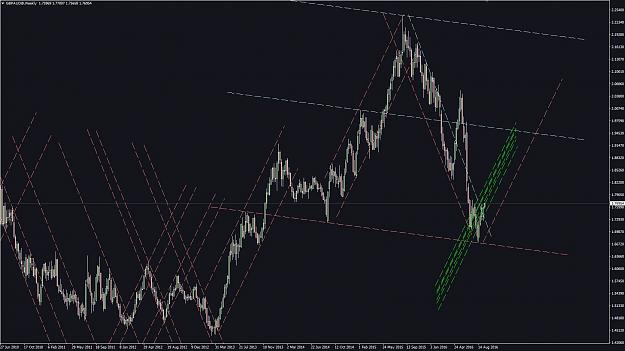
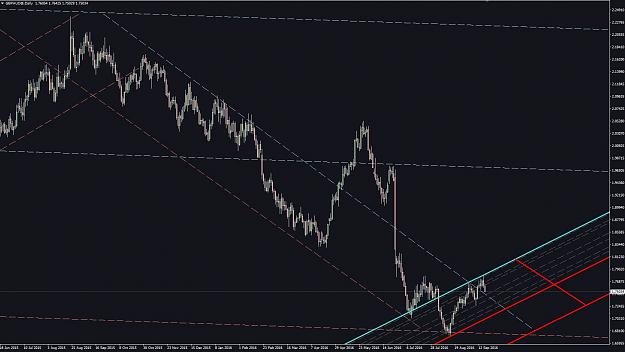
this is the gbpaud weekly chart
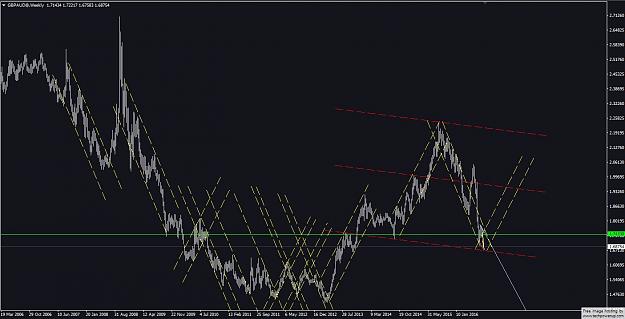
as you can see it usually moves up and down in a channel with specific angle
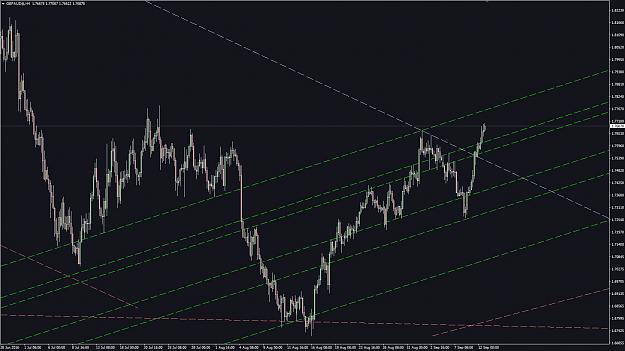
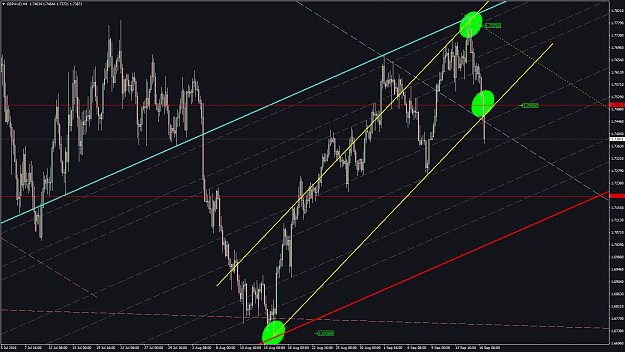
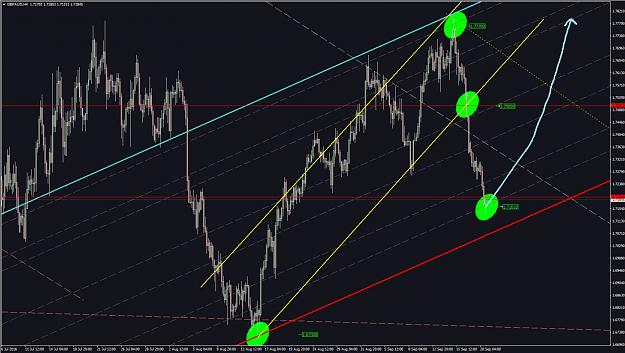
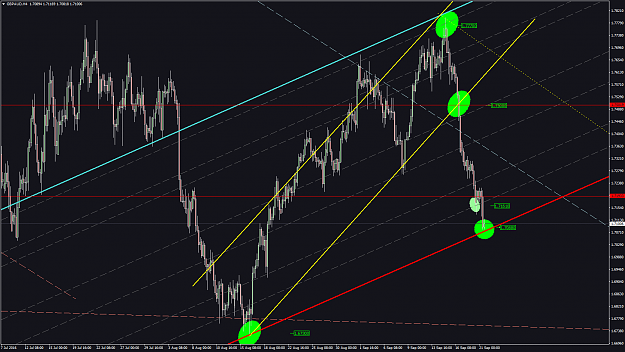
this is the daily chart
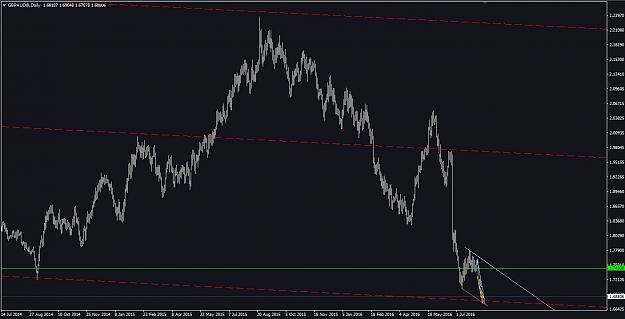
what about we wait for it to rebound from the lower trend line (if that happens)
then wait for it to build an uptrend with the same angle it is used to
then wait for it to be on the lower trend line of the newly formed channel
and plant longs (targeting the green line for now) (700 pips)
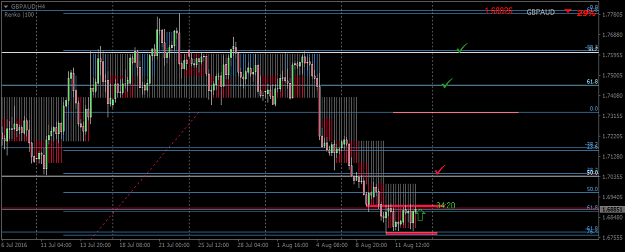
note that it still have ~80 pips down chance based on this 15 minute chart
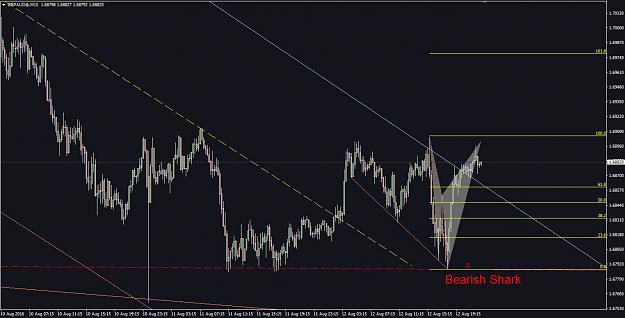
and from there (1.6790) or if it goes down more to touch the lower weekly TL (1.6730) we can start watching/waiting the new uptrend.
Attached Image (click to enlarge)
as you can see it usually moves up and down in a channel with specific angle
this is the daily chart
Attached Image (click to enlarge)
what about we wait for it to rebound from the lower trend line (if that happens)
then wait for it to build an uptrend with the same angle it is used to
then wait for it to be on the lower trend line of the newly formed channel
and plant longs (targeting the green line for now) (700 pips)
note that it still have ~80 pips down chance based on this 15 minute chart
Attached Image (click to enlarge)
and from there (1.6790) or if it goes down more to touch the lower weekly TL (1.6730) we can start watching/waiting the new uptrend.