N-Ticks charts are price-time graphs of candles each of which has equal number of ticks. The EA must be attached to M1 Charts, and the minimum number of ticks is N = 2. In such charts the tick volume of each candle is equal to N. In the following chart, N is set to 10 ticks. 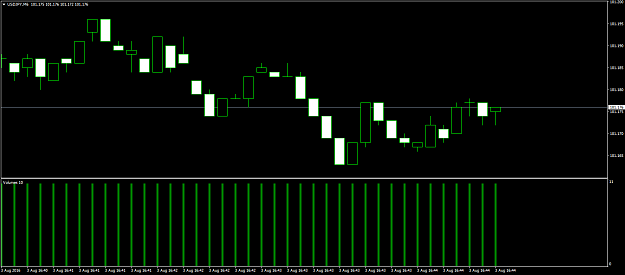
Below is a chart of 250 ticks, 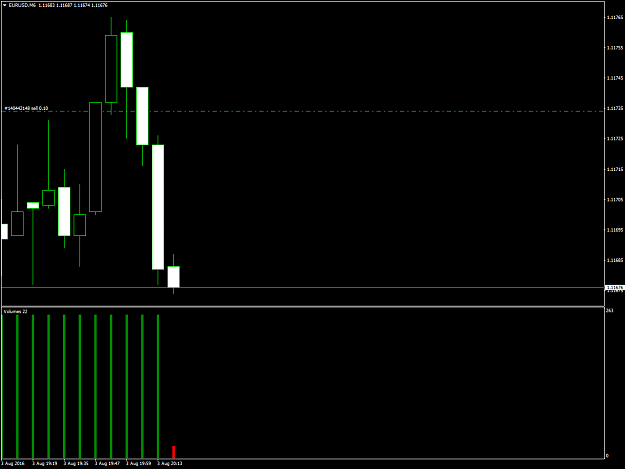
Thread Rules:
1. In this thread we only discuss N-Ticks Chart Creator EA presented here. I will IGNORE anyone who writes any irrelevant post in this thread.
2. TBD.
--- Update 2018-07-08 ------
Version 1.02 released. In this version, I fixed the bug causing MT4 to freeze (abnormal termination error fix).
Note: THIS IS AN EXPERIMENTAL VERSION (beta). Please report any bug you may face in this version.
Attached Image (click to enlarge)
Below is a chart of 250 ticks,
Attached Image (click to enlarge)
Attached File(s)
Thread Rules:
1. In this thread we only discuss N-Ticks Chart Creator EA presented here. I will IGNORE anyone who writes any irrelevant post in this thread.
2. TBD.
--- Update 2018-07-08 ------
Version 1.02 released. In this version, I fixed the bug causing MT4 to freeze (abnormal termination error fix).
Note: THIS IS AN EXPERIMENTAL VERSION (beta). Please report any bug you may face in this version.
Attached File(s)
Trading is the hardest way to make easy money...