The first thing I want to do is to apologize for my English.
It is not a trading system in its pure form , it is a method of analysis.
I want to share a method of searching for S \ R Levels that I use for a long time.
A bit of prehistory , when I started to get involved in trade , I was quickly interested in S \ R trade. I began to analyze them , but many levels that I could determine if were not so good as now . In the subsequent time I developed a simple method to find a good level. Let's start !...
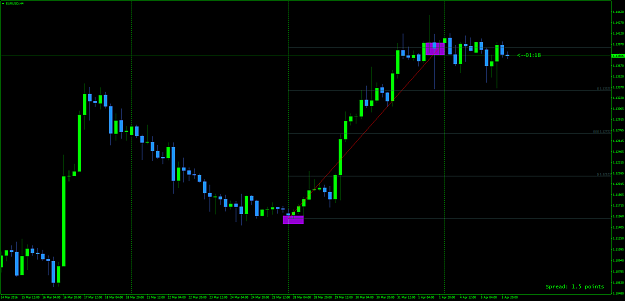
There are some important things for a certain period , for example , maximum and minimum of the most important - the closing . So I chose a maximum of + close , low + close . I then divide the price by 2. ( 105 + 95 ) / 2 = 100 . Got level.
It is easy to use with Fibonacci grid. Configure Fibonacci 25 % 50 % 75 %.
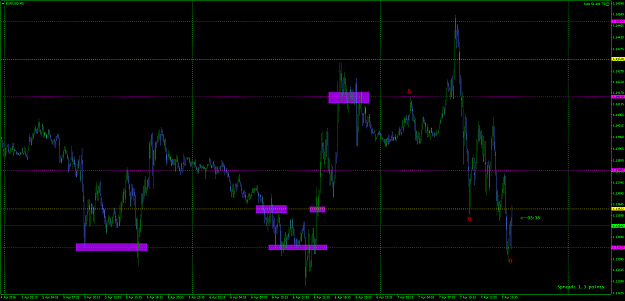
1) Apply the grid to a maximum and closing. Low and close . It often happens that there are two tools for the analysis , I use both for analysis. But it happens like last week is one big movement , and we have one normal and one tool is very small ( I do not use them)
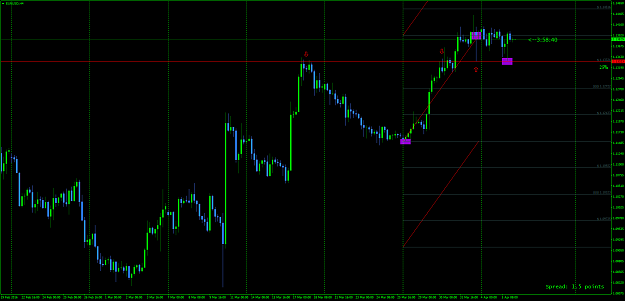
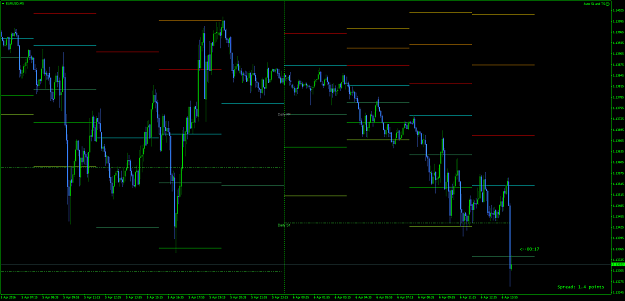
2) Then I create a few more up and down . ( see below )
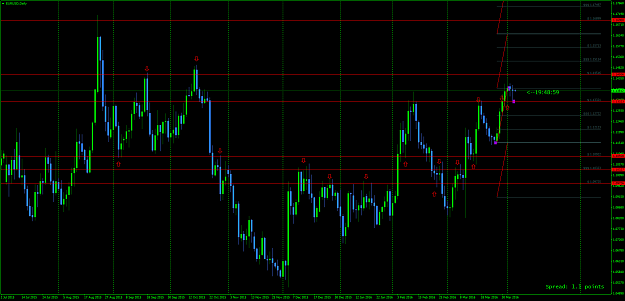
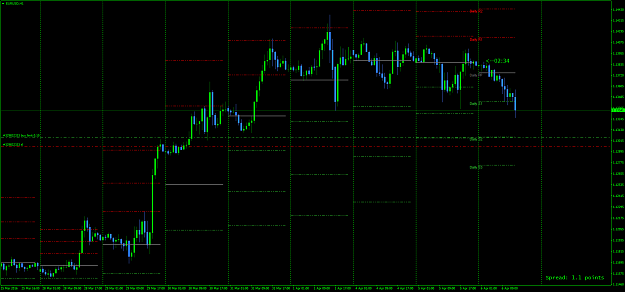
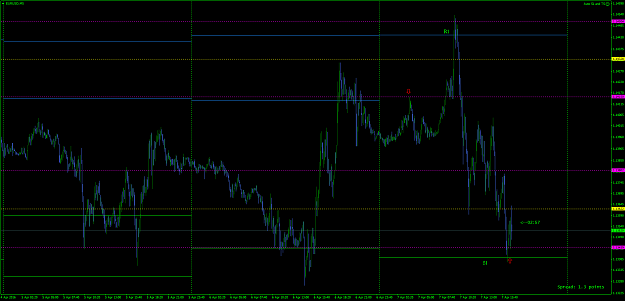
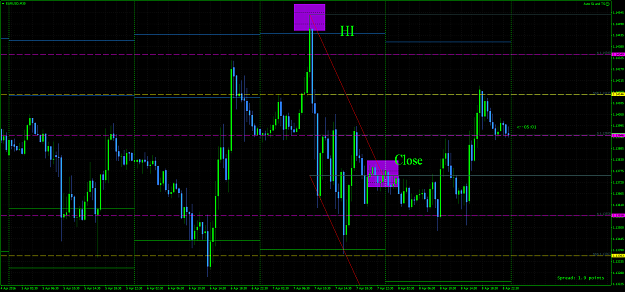
3) Now I'll look for a good touch and rebound from these Fibonacci grid , those that I had a good answer vertical line . (red line)
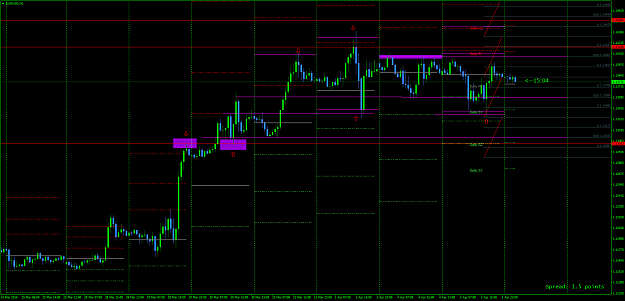
Now I have a good level that will be used in the analysis of this week. For more lower values used daily Ranges for larger month.
Below the image , with examples
Green pips for all!
It is not a trading system in its pure form , it is a method of analysis.
I want to share a method of searching for S \ R Levels that I use for a long time.
A bit of prehistory , when I started to get involved in trade , I was quickly interested in S \ R trade. I began to analyze them , but many levels that I could determine if were not so good as now . In the subsequent time I developed a simple method to find a good level. Let's start !...
There are some important things for a certain period , for example , maximum and minimum of the most important - the closing . So I chose a maximum of + close , low + close . I then divide the price by 2. ( 105 + 95 ) / 2 = 100 . Got level.
It is easy to use with Fibonacci grid. Configure Fibonacci 25 % 50 % 75 %.
1) Apply the grid to a maximum and closing. Low and close . It often happens that there are two tools for the analysis , I use both for analysis. But it happens like last week is one big movement , and we have one normal and one tool is very small ( I do not use them)
2) Then I create a few more up and down . ( see below )
3) Now I'll look for a good touch and rebound from these Fibonacci grid , those that I had a good answer vertical line . (red line)
Now I have a good level that will be used in the analysis of this week. For more lower values used daily Ranges for larger month.
Below the image , with examples
Green pips for all!
Attached Image(s) (click to enlarge)