Unfortunately the links in Adal's post are broken. Perhaps I'm trying to do something like he did. I'll never know.
QuoteDislikedSo the results are conditional on market volatility. Maybe this is the answer you've been looking for?
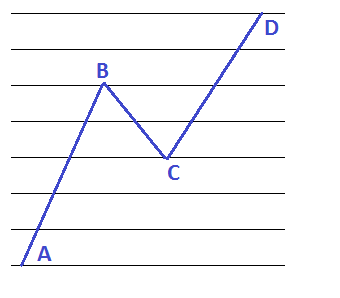
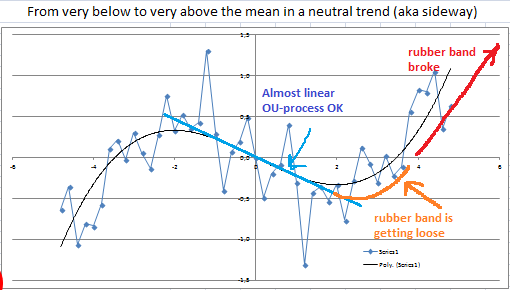
Volatitily is part of the diffusion equations like OU-process. The problem is that the Ornstein–Uhlenbeck model is not modeling the market properly. Their model states that the market is like a spring or a rubber band: the more you stretch it the more it will create a force to come back to its rest/equilibrum position. Hooke's law. But in the market at some point the rubber band breaks and market runs away. Additionally in the market the "spring constant" is not constant! It depends on the distance. You can see it on the heatmap Post #18. Here is the graph repeated. As a reminder the X axis is the relative position of the price with respect to the mean. Here it is in a ranging market (trend set to 0). x<0 means below the mean. Y axis is a value representing if you should buy (y>0) or sell (y<0).
Attached Image
No greed. No fear. Just maths.