Sometimes I see a perfectly trending pair, whatever and then I remember this chart:
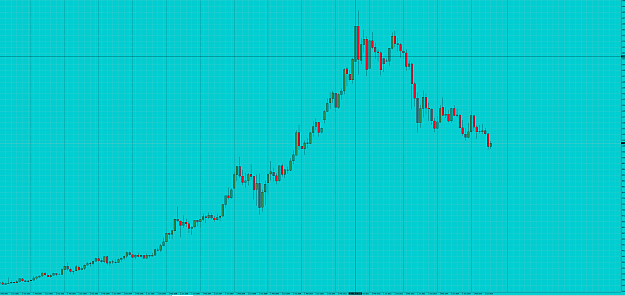
For 10 years was a nice trending, except a few months.
It is just trade blind: open a long position and when you have enough floating profit open another one.... and you become billionaire, well in 10 years.
Then something happent.
The chart is for Gold / USD.
Bitcoin too: http://bitcoincharts.com/charts/bits...zm1g10zm2g25zv
3 years up, then down
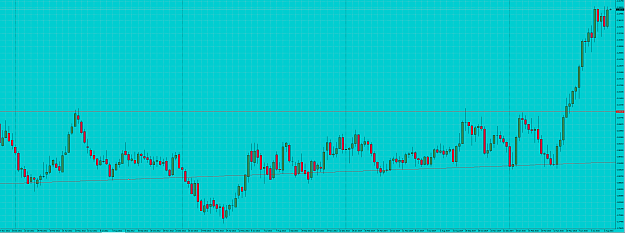
- and many many. Even the most popular EUR/USD: from 2001 to 2008 up ( 7 years) then down, then ranging down.
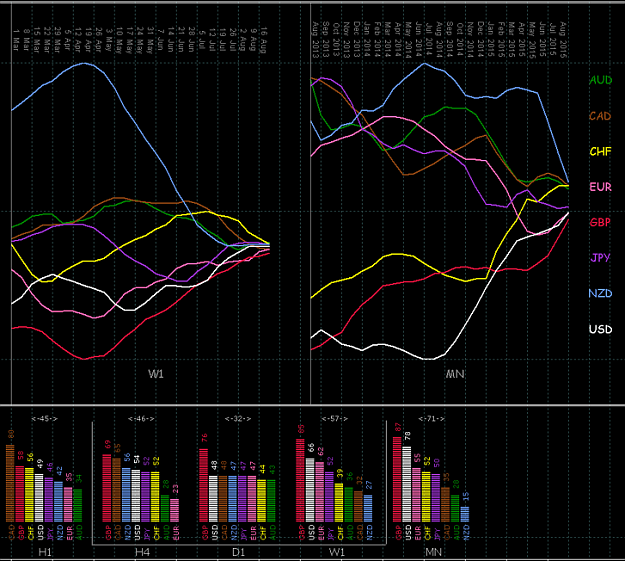
Are the the FOCM statements?
Attached Image (click to enlarge)
For 10 years was a nice trending, except a few months.
It is just trade blind: open a long position and when you have enough floating profit open another one.... and you become billionaire, well in 10 years.
Then something happent.
The chart is for Gold / USD.
Bitcoin too: http://bitcoincharts.com/charts/bits...zm1g10zm2g25zv
3 years up, then down
- and many many. Even the most popular EUR/USD: from 2001 to 2008 up ( 7 years) then down, then ranging down.
Are the the FOCM statements?
I want to buy PATIENCE