I'm shocked, I can't believe it, I've crossed some threshhold where I'm allowed to start a thread, thank you forex gods.
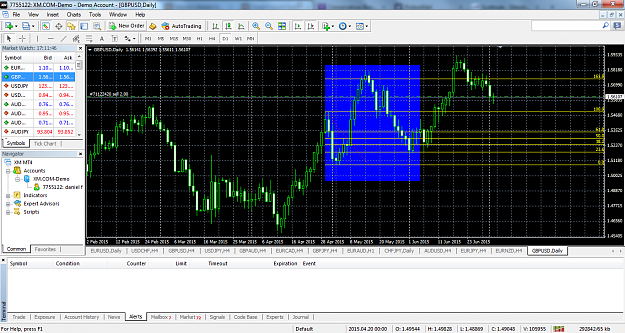
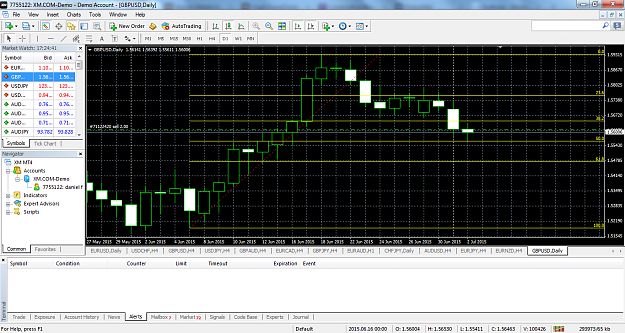
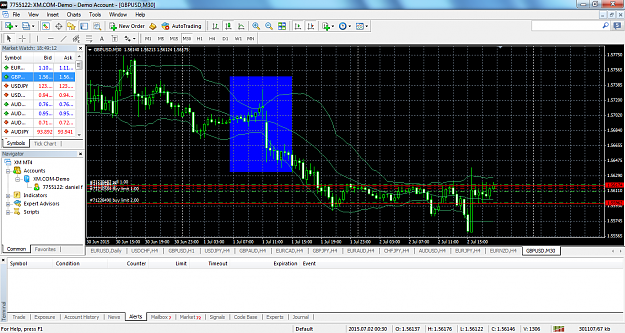
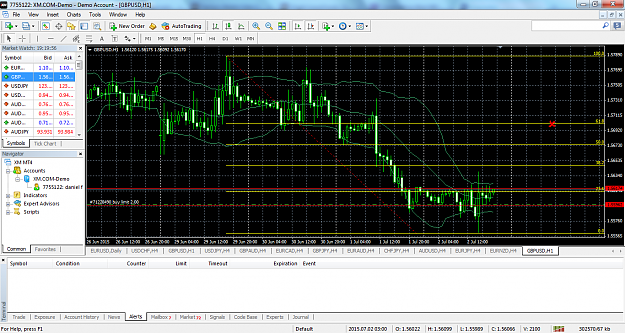
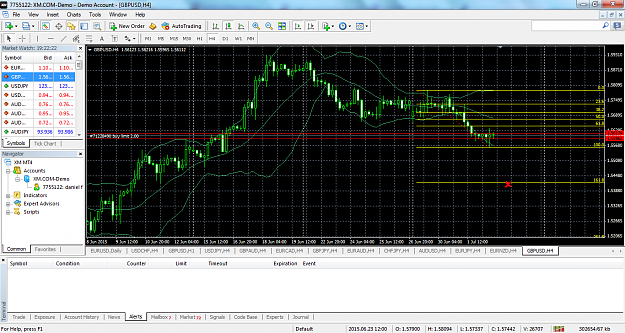
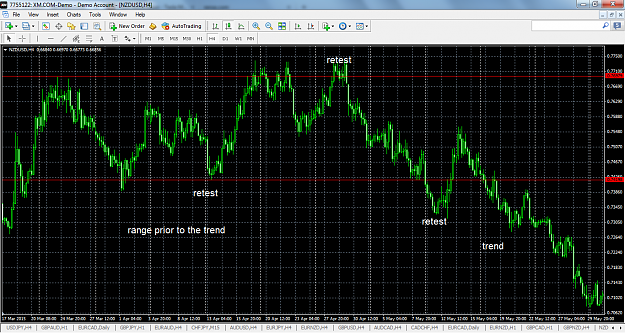
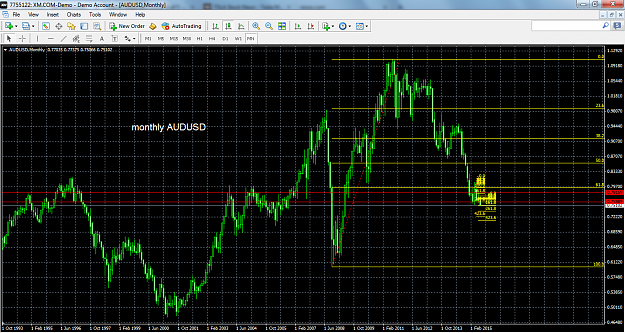
What I propose for this thread is to throw up, and I do mean throw up, some charts with fib scales to view where the price might go. For instance I'd like to show an example here of what I mean with the gbpusd on a daily TF.
Attachment
This might be too long range for many traders, the price basically sat on the 23% for a month, which for scalpers is a great trading opportunity if they are hunting for scalping or short range trading opportunities. Of course that has passed but if I post daily it will become obvious that a pattern is emerging leading to opportunity. Now it appears to be moving out to the downside. The gbpusd appears to range on the daily TF just like the gbpjpy, which makes for huge ranges and great opportunities if you get in at the beginning.
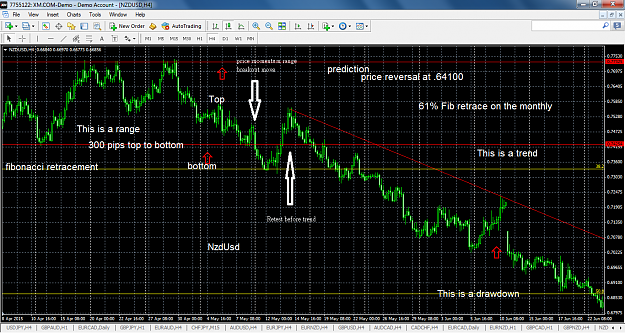
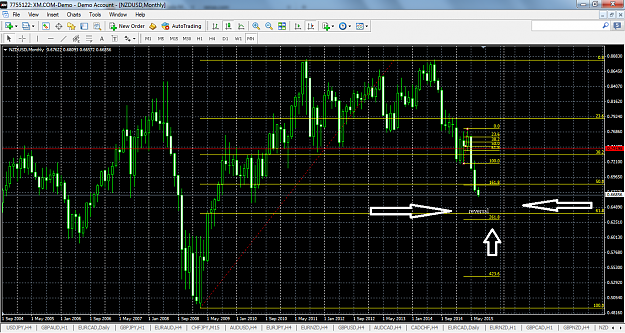
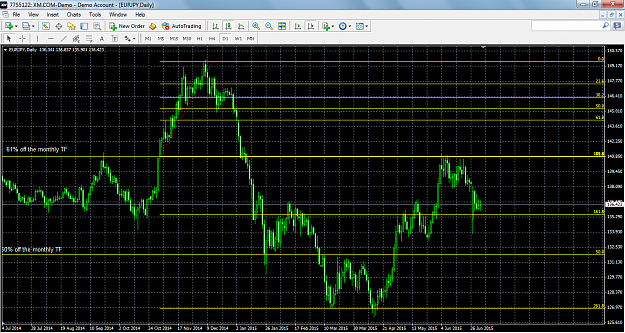
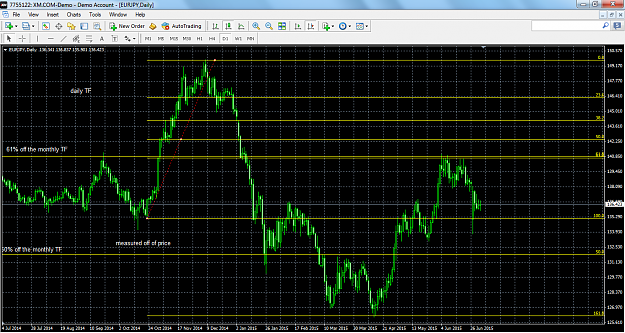
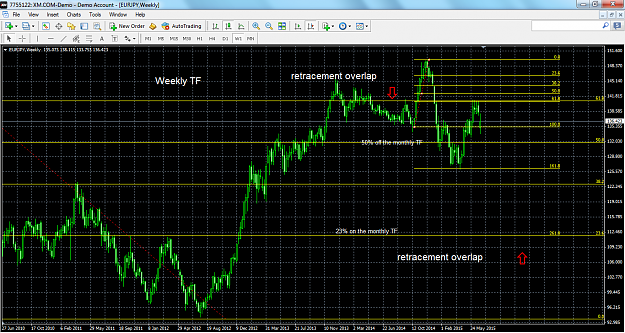
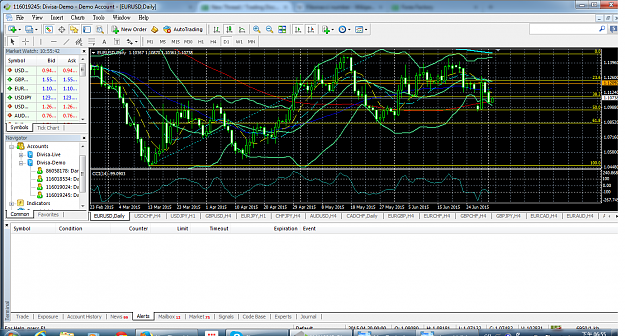
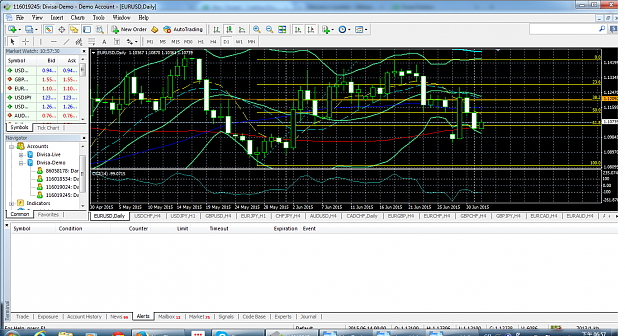
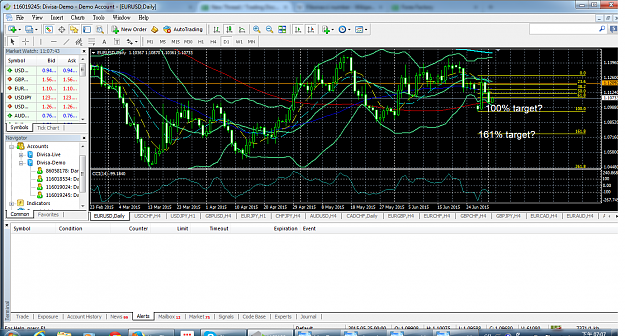
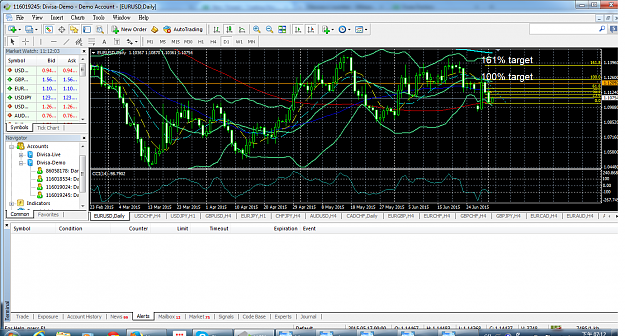
Looking at the eurusd, the price hit the 61% over a month ago, it then proceeded up and returned again smashing through support on the past monday. Is this a fake out, is the market deliberately trying to trick me, if not me then you, if they are, then where is the price going? All of this of course is based on the ridiculous idea that fibonacci scales have anything to do with anything.
So what I'd like to do is post observations like this for all kinds of pairs, if the powers that be will allow it.
What I propose for this thread is to throw up, and I do mean throw up, some charts with fib scales to view where the price might go. For instance I'd like to show an example here of what I mean with the gbpusd on a daily TF.
Attachment
This might be too long range for many traders, the price basically sat on the 23% for a month, which for scalpers is a great trading opportunity if they are hunting for scalping or short range trading opportunities. Of course that has passed but if I post daily it will become obvious that a pattern is emerging leading to opportunity. Now it appears to be moving out to the downside. The gbpusd appears to range on the daily TF just like the gbpjpy, which makes for huge ranges and great opportunities if you get in at the beginning.
Looking at the eurusd, the price hit the 61% over a month ago, it then proceeded up and returned again smashing through support on the past monday. Is this a fake out, is the market deliberately trying to trick me, if not me then you, if they are, then where is the price going? All of this of course is based on the ridiculous idea that fibonacci scales have anything to do with anything.
Attached Image (click to enlarge)
Attached Image (click to enlarge)
Attached Image (click to enlarge)
Attached Image (click to enlarge)
So what I'd like to do is post observations like this for all kinds of pairs, if the powers that be will allow it.