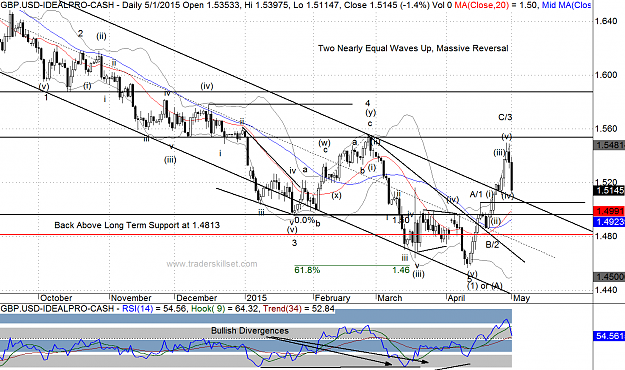
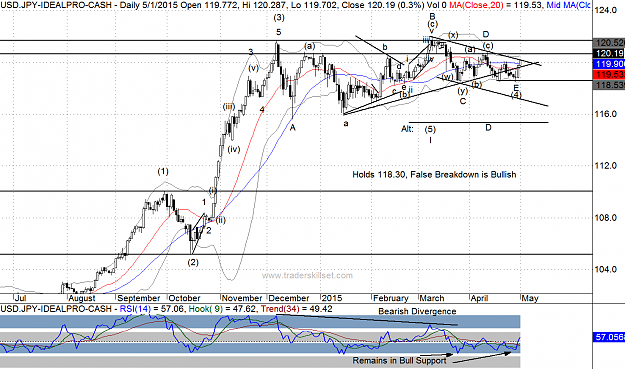
We’ve been citing the 118.30 level in USDJPY for some time now, suggesting that a drop below that spelled the end of this rally. Mid week it looked like a breakdown just might be in store, but after breaking below 118.55 briefly, prices reversed sharply. Such a false breakdown, the opposite of NZD’s false breakout, is a bullish signal. We’re now bullish against 118.49 looking for new highs. Keep in mind that RSI remained above “Sustainable Bear” territory the entire sideways correction, which is not action that suggests lower prices. We’ve left the “topped” count as an alternate, but it’s a distant alternate as of now.
Read more on the TraderSkillset website | Combine Elliott & RSI For Clues | http://traderskillset.com/elliott-rsi/
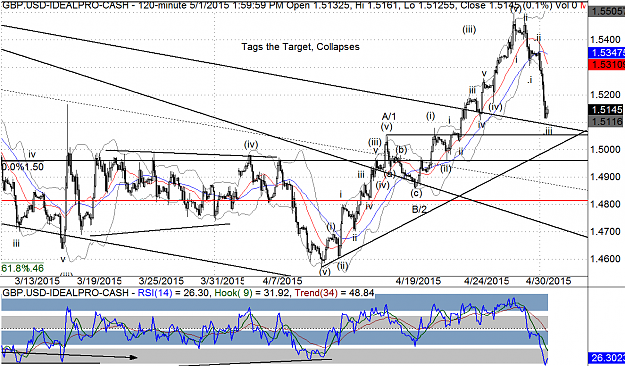
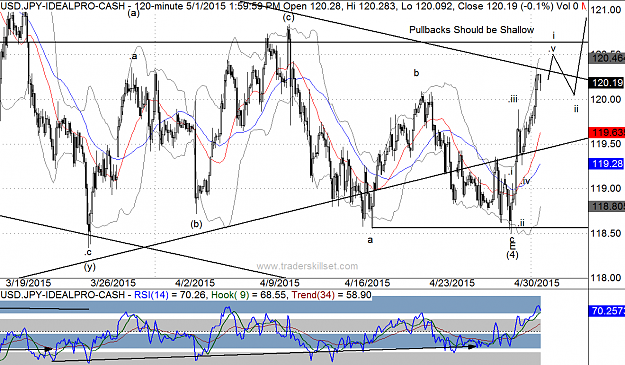
Often thrusts from triangles can appear to be one straight wave, with small, sideways corrections rather than something more “normal.” That’s what we’re looking for here, although the 120.70 has been stiff resistance for some time now. We’re looking to turn aggressively bullish into anything resembling corrective action. Critical support is 118.49, but prices have no business below 119.10 if our count is correct. Notice the behavior of RSI here too, where it hit Sustainable Bull territory on Friday, after bottoming above bear territory into the wave E bottom.
Read more on the TraderSkillset website | Combine Elliott & RSI For Clues | http://traderskillset.com/elliott-rsi/
Attached Image (click to enlarge)
Often thrusts from triangles can appear to be one straight wave, with small, sideways corrections rather than something more “normal.” That’s what we’re looking for here, although the 120.70 has been stiff resistance for some time now. We’re looking to turn aggressively bullish into anything resembling corrective action. Critical support is 118.49, but prices have no business below 119.10 if our count is correct. Notice the behavior of RSI here too, where it hit Sustainable Bull territory on Friday, after bottoming above bear territory into the wave E bottom.
Attached Image (click to enlarge)