Several people have sent me PMs to ask about my ADX Engulfing Millipede Trade Explorer and the system, so I thought I’d post it in a thread.
First off – there is nothing really new in it – it is several jigsaw pieces that I have put together to make a picture that works for me. Thanks and ackledgement must go to pipEasy for revealing so much. Bobi Abonacci for showing me (inadvertently) how to find some great long-term targets and be patient and wait, HDA for demonstrating how to stick to your plan, and FXDayTrader for helping get the indicators to work as I wanted them and many others who have shaped my journey so far (I’m still learning, but feel I’ve turned a corner)
I believe you only really need one trading skill to be profitable. And that is an entry method that stands a good chance of getting to break even.
Once you have that (and that’s relatively easy to find – there are hundreds of threads on FF that will provide that, but I’ll show you what I tend to use), then everything else is about controlling your head and heart.
So, lets’ start with the ‘Millipede’ element of the thread title
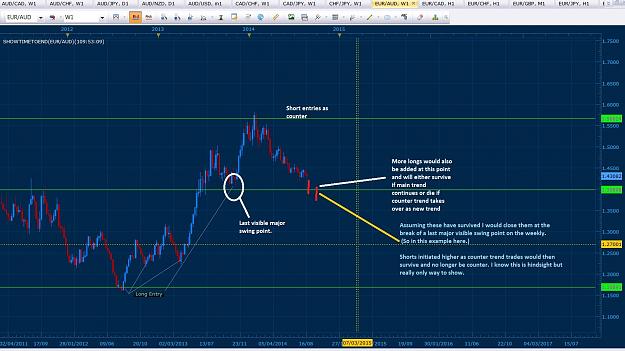
This is a long-term swing/position trading method. The aim is to build multiple positions in the direction of the long-term trend and holding them for massive profits. I came to understand (and love) the power of this through reading Graham’s (pipEasy’s) Building and Equity Millipede thread. Before doing anything else read that – take your time and absorb the principles. There is a PDF of Graham’s posts attached to this post.
In short, what we are looking to do is participate in the market. Let’s break a myth here. Many believe to be a position trader you must operate with a large stop loss and therefore according to good money management must necessarily have a proportionately small lot size. This is a very narrow view of position trading.
In reality, all you need to do is get into a trade with a tight SL and as soon as the danger area has been passed move it to BE and forget about it. Then do it again, and again and again. You will have many trades close at BE or a small loss, but that’s ok. This is the first battle your head and heart needs to face – you may have weeks/month of trades closing at BE or a loss before you get traction and trades establish in your favour. You can lose 30-50 trades to establish 5-10 good positions. Can you cope with that? Can your mind deal with multiple losses KNOWING that it will come good and your wins will FAR outweigh those small loses.
Generally speaking you want to focus your entries in the direction of the long-term trend (weekly/monthly). As Graham says, ‘the trend is not going to change just because you’ve turned up with a demo account’.
If you are not sure of the trend then either find another pair where there is a clear trend or enter trades both ways and let the market sort it out. You can easily enter several trades long and several short. Then just let the market sort out which survive. pipEasy described each position as a soldier – some will survive, but many will be sacrificed. But the ones that survive will bring home the glory (not a desperately politically correct analogy in current times, but you get the idea).
As far as taking profit is concerned that is a personal thing the general idea is to let trades run until you sense the trend is stalling or reversing and then close some out of big profits and let the others run, or start entering the other way. Graham devotes a lot time to discussing and describing his principles, which I believe are sound, so I am not going to repeat them here.
So – that’s the ‘Millipede’ bit dealt with, now the ‘ADX Engulfing’
ADX
So, if we’re entering trades and want a good chance to get them to BE, then we are looking for momentum. I have found the ADX indicator very helpful in seeing where the momentum is, and anticipating it.
Basically you have 3 lines, D+ (green), D- (red) and ADX (white). There are three levels I have marked out 10, 25, 40.
The D+ shows the strength of the bulls, the D- the strength of the bears.
When green is above red, the bulls are stronger
When red above green, the bears are stronger.
The ADX line is used to indicate just how strong the bears or bulls are (ie the strength of the trend). Pointing up, means getting stronger, above 25 means strong trend, above 40 means very strong trend.
On the chart below, the green arrows show D+ crossing above D-, and the red arrows show D- crossing above D+.
Application - you can use it as a filter to see the consolidation and breakout into your trade. You can also use it as the BE signal – ie move to BE on the next ADX cross after your entry.
As they say, a picture says a thousand words (ignore the chart layout, that’s from my other thread)
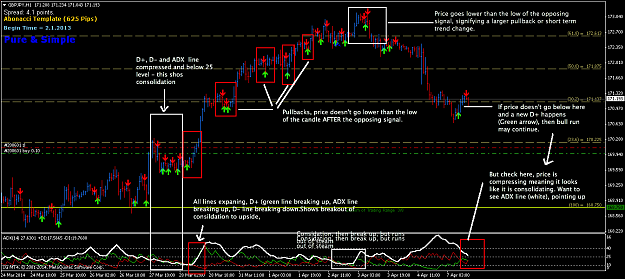
On the template attached to the post you will see I have two ADX indicators, one shows the lines, and the other shows the multi time frame crosses – this gives me something of an overall view of the MTF trends.
ENGULFING
Pretty much does what it says on the tin. Remember we are looking for momentum. Engulfing, outside bars, pin bars are all signs of momentum. To me, they indicate a good chance of a trade getting to BE. Trading them at the 50% retrace improves that probability even more.
NB
Other things to bear in mind are daily/weekly/monthly supply and demand zones – and support and resistance levels - these are areas I am watching for good action to start building positions.
So, to summarise.
1. Find momentum enter and get trade to BE - Be Patient
2. Repeat - Be Patient
3. Don’t worry about small losses or BE closes - Be Patient
4. Hold positions - Be Patient
EXAMPLE
As posted in the Cable thread – I recently traded this method on the recent downturn, which I believe is a correction in the longterm bull trend.
I closed out 19 separate trades for 4388 pips (across two live accounts)
However, that’s not the full story – to establish those positions I had to enter 71 trades – 20% were closed at BE, 55% with a small loss and those wins were the remaining 25%.
Once the losses and BEs are taken off the total profit was 3371 pips. My average loss was much bigger than it should have been due to a lapse of discipline, Across my entire account my average loss is 12 pips, but the wins are in the hundreds and thousands.
Now, I am building long positions for the bull trend to continue - do I think it will start now. I don't know. But as long as I manage the risk, get the positions to BE, I will be there to capitalise when it does.
TEMPLATE & INDICATORS
They’re attached below (I hope it all works - you may have to play around with it). The template looks busier than I would like, but I need to have push notifications etc as I am not at my computer to watch for signals much anymore during trading times, so I use a virtual server sending me split second notifications that I can check and trade on my smart phone. I have notifications set to let me know about pin bars, engulfing, outside bars and ADX crosses.
You will see a few MAs, I don’t really use them to trade other than to help me see were dynamic SR may be.
So that’s it – I hope something is useful to somebody. Feel free to ask any questions - if my explanations are unclear, I will edit this post to clarify. I'm no expert, I've just found something that works for me and my life/trading style.
Thanks and green pips to all
Steve
First off – there is nothing really new in it – it is several jigsaw pieces that I have put together to make a picture that works for me. Thanks and ackledgement must go to pipEasy for revealing so much. Bobi Abonacci for showing me (inadvertently) how to find some great long-term targets and be patient and wait, HDA for demonstrating how to stick to your plan, and FXDayTrader for helping get the indicators to work as I wanted them and many others who have shaped my journey so far (I’m still learning, but feel I’ve turned a corner)
I believe you only really need one trading skill to be profitable. And that is an entry method that stands a good chance of getting to break even.
Once you have that (and that’s relatively easy to find – there are hundreds of threads on FF that will provide that, but I’ll show you what I tend to use), then everything else is about controlling your head and heart.
So, lets’ start with the ‘Millipede’ element of the thread title
This is a long-term swing/position trading method. The aim is to build multiple positions in the direction of the long-term trend and holding them for massive profits. I came to understand (and love) the power of this through reading Graham’s (pipEasy’s) Building and Equity Millipede thread. Before doing anything else read that – take your time and absorb the principles. There is a PDF of Graham’s posts attached to this post.
In short, what we are looking to do is participate in the market. Let’s break a myth here. Many believe to be a position trader you must operate with a large stop loss and therefore according to good money management must necessarily have a proportionately small lot size. This is a very narrow view of position trading.
In reality, all you need to do is get into a trade with a tight SL and as soon as the danger area has been passed move it to BE and forget about it. Then do it again, and again and again. You will have many trades close at BE or a small loss, but that’s ok. This is the first battle your head and heart needs to face – you may have weeks/month of trades closing at BE or a loss before you get traction and trades establish in your favour. You can lose 30-50 trades to establish 5-10 good positions. Can you cope with that? Can your mind deal with multiple losses KNOWING that it will come good and your wins will FAR outweigh those small loses.
Generally speaking you want to focus your entries in the direction of the long-term trend (weekly/monthly). As Graham says, ‘the trend is not going to change just because you’ve turned up with a demo account’.
If you are not sure of the trend then either find another pair where there is a clear trend or enter trades both ways and let the market sort it out. You can easily enter several trades long and several short. Then just let the market sort out which survive. pipEasy described each position as a soldier – some will survive, but many will be sacrificed. But the ones that survive will bring home the glory (not a desperately politically correct analogy in current times, but you get the idea).
As far as taking profit is concerned that is a personal thing the general idea is to let trades run until you sense the trend is stalling or reversing and then close some out of big profits and let the others run, or start entering the other way. Graham devotes a lot time to discussing and describing his principles, which I believe are sound, so I am not going to repeat them here.
So – that’s the ‘Millipede’ bit dealt with, now the ‘ADX Engulfing’
ADX
So, if we’re entering trades and want a good chance to get them to BE, then we are looking for momentum. I have found the ADX indicator very helpful in seeing where the momentum is, and anticipating it.
Basically you have 3 lines, D+ (green), D- (red) and ADX (white). There are three levels I have marked out 10, 25, 40.
The D+ shows the strength of the bulls, the D- the strength of the bears.
When green is above red, the bulls are stronger
When red above green, the bears are stronger.
The ADX line is used to indicate just how strong the bears or bulls are (ie the strength of the trend). Pointing up, means getting stronger, above 25 means strong trend, above 40 means very strong trend.
On the chart below, the green arrows show D+ crossing above D-, and the red arrows show D- crossing above D+.
Application - you can use it as a filter to see the consolidation and breakout into your trade. You can also use it as the BE signal – ie move to BE on the next ADX cross after your entry.
As they say, a picture says a thousand words (ignore the chart layout, that’s from my other thread)
Attached Image (click to enlarge)
On the template attached to the post you will see I have two ADX indicators, one shows the lines, and the other shows the multi time frame crosses – this gives me something of an overall view of the MTF trends.
ENGULFING
Pretty much does what it says on the tin. Remember we are looking for momentum. Engulfing, outside bars, pin bars are all signs of momentum. To me, they indicate a good chance of a trade getting to BE. Trading them at the 50% retrace improves that probability even more.
NB
Other things to bear in mind are daily/weekly/monthly supply and demand zones – and support and resistance levels - these are areas I am watching for good action to start building positions.
So, to summarise.
1. Find momentum enter and get trade to BE - Be Patient
2. Repeat - Be Patient
3. Don’t worry about small losses or BE closes - Be Patient
4. Hold positions - Be Patient
EXAMPLE
As posted in the Cable thread – I recently traded this method on the recent downturn, which I believe is a correction in the longterm bull trend.
I closed out 19 separate trades for 4388 pips (across two live accounts)
Disliked{quote} Added one more short - I think that may be it, unless I see something really obvious. (Charts for the two accounts for those who insist messaging for proof) Good trading all. {image}{image}Ignored
Disliked{quote} I've decided to close out - going away next week and not sure whether I will have internet access, so it's close enough. Total stats for this pullback - 19 trades across two accounts held short for a total of 4388pips. 11 of the trades on the chart below. {image} PATIENCE PAYS Good luck everyone - have a great weekend.Ignored
However, that’s not the full story – to establish those positions I had to enter 71 trades – 20% were closed at BE, 55% with a small loss and those wins were the remaining 25%.
Once the losses and BEs are taken off the total profit was 3371 pips. My average loss was much bigger than it should have been due to a lapse of discipline, Across my entire account my average loss is 12 pips, but the wins are in the hundreds and thousands.
Now, I am building long positions for the bull trend to continue - do I think it will start now. I don't know. But as long as I manage the risk, get the positions to BE, I will be there to capitalise when it does.
TEMPLATE & INDICATORS
They’re attached below (I hope it all works - you may have to play around with it). The template looks busier than I would like, but I need to have push notifications etc as I am not at my computer to watch for signals much anymore during trading times, so I use a virtual server sending me split second notifications that I can check and trade on my smart phone. I have notifications set to let me know about pin bars, engulfing, outside bars and ADX crosses.
You will see a few MAs, I don’t really use them to trade other than to help me see were dynamic SR may be.
So that’s it – I hope something is useful to somebody. Feel free to ask any questions - if my explanations are unclear, I will edit this post to clarify. I'm no expert, I've just found something that works for me and my life/trading style.
Thanks and green pips to all
Steve
Attached File(s)
Attached File(s)