• Home
  • Forums
  • News
  • Calendar
  • Coins
  • Market
  • Login
  • Join
  • User/Email: Password:
  • 2:47am
Menu
  • Forums
  • News
  • Calendar
  • Coins
  • Market
  • Login
  • Join
  • 2:47am
Sister Sites
  • Metals Mine
  • Energy EXCH
  • Forex Factory

Options

Bookmark Thread

First Page First Unread Last Page Last Post

Print Thread

Similar Threads

Bitcoin Analysis 22 replies

Bitcoin-Family math and technical analysis 20 replies

Fundamental Analysis, Technical Analysis Or Graph Analysis? 28 replies

  • Interactive Trading
  • /
  • Reply to Thread
  • Subscribe
  • 3,845
Attachments: Bitcoin technical analysis
Exit Attachments
Tags: Bitcoin technical analysis
Cancel

Bitcoin technical analysis

  • Last Post
  •  
  • 1 202203Page 204205206 504
  • 1 Page 204 504
  •  
  • Post #4,061
  • Quote
  • Edited 8:06am Jun 6, 2014 6:42am | Edited 8:06am
  •  venzen
  • Joined Jul 2011 | Status: good | 4,295 Posts
Quoting venzen
Disliked
{quote} Hi lady_luck, Everything is in place for the launch. If price breaks below the uptrendline we might see a prolonged sideways or even change of trend - small possibility - but mustn't be ignored, altho going by the pattern until now, prolonged consolidation is more likely imo.
Ignored
Comparing patterns today I came to the conclusion that price may still be in "lady_luck green circle". In this scenario price has come down from the top of wave 5 in an A wave and is making an ascending B wave triangle - with an explosive final subwave "e" - from the top of "e"(end of B) price drops in a C wave to the 4th of one lesser degree.

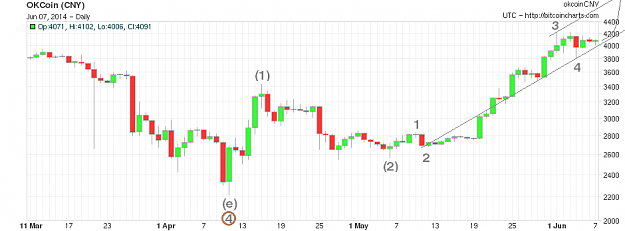
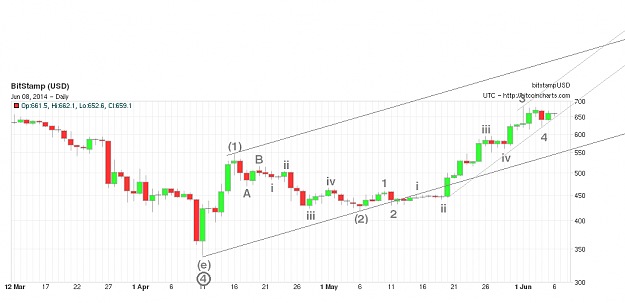
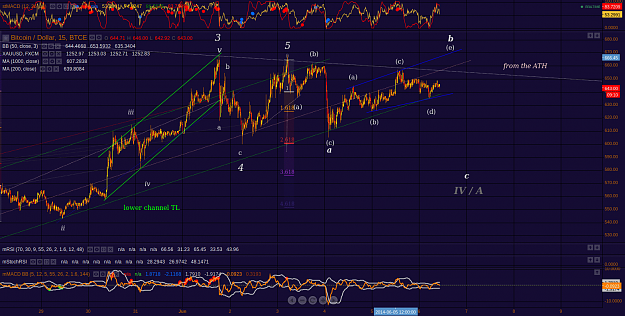
If the above is the case then the 4th of one lesser degree can be found around 31 May at 580 (BTCe) and 610 (Bitfinex). I don't have a Bitstamp chart open to confirm.

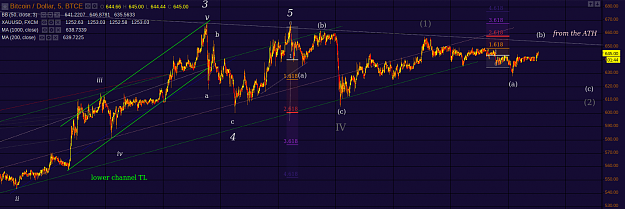
Depending on whether or not there was any extension of the last wave up since 27 May, the correction could also drop to the area of wave "ii" of the extension - for BTCe this is near 560.

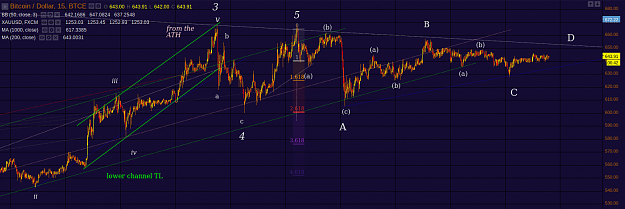
This count means the advance is on hold for now, because after the C wave drop, wave 1 and 2 of the new wave up will consolidate sideways (in a cyan rectangle pattern) for a week or so before the next larger degree blast toward 1000.

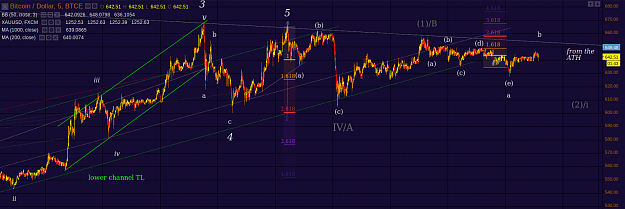
However, note that the wave patterns (of the current "b" wave) closely resemble the action after the wave "ii" low (bottom left) - only bigger! If my count is wrong or consolidation has happened quicker than in the past, then we could be going up ferociously at any moment. This duality means one would probably be better off to position via orders if you want to catch the move in either direction. For me the potential danger is that the initial blast up is an "e" wave fake-out WHILST being mindful that it could be a rapid ascent to 700 and beyond.

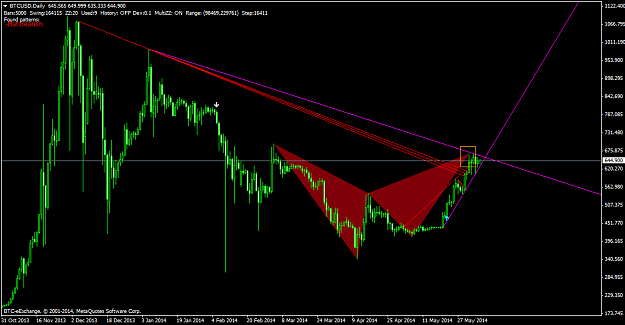
From the more bearish perspective: If this is a C wave top since the April low then the worst of the downtrend is about to begin - but this scenario has only minimal probability for now - yet if it must manifest then this is one such opportunity.

Attached Image (click to enlarge)
Click to Enlarge

Name: Selection_044.png
Size: 123 KB
cryptocurrency everytime
 
 
  • Post #4,062
  • Quote
  • Jun 6, 2014 6:50am Jun 6, 2014 6:50am
  •  dswk
  • Joined Feb 2006 | Status: Pips Pod... | 1,611 Posts
mornin'

Still the same bearish pattern in D1.

I've exited all my buy and all my sell. Just try to find what would be the next catalyst to a proper move. (But still think bearish as from now)
Attached Image (click to enlarge)
Click to Enlarge

Name: btcusd-d1-distel-enterprise.png
Size: 49 KB
 
 
  • Post #4,063
  • Quote
  • Jun 7, 2014 4:13am Jun 7, 2014 4:13am
  •  emptymind
  • | Joined Dec 2013 | Status: Member | 457 Posts
Attached Image (click to enlarge)
Click to Enlarge

Name: chart.png
Size: 17 KB
 
 
  • Post #4,064
  • Quote
  • Edited 10:05am Jun 7, 2014 8:58am | Edited 10:05am
  •  venzen
  • Joined Jul 2011 | Status: good | 4,295 Posts
My count yesterday was wrong - the ABC down is done and price is apparently in the cyan box - playing out a sideways 1-2.

If this is the case we should complete wave (b) of (2) around 650 (at the upper TL) and then make the final C wave to complete 2 and begin advancing again.

Alternatively, sideways consolidation drags out and another structure with other implications for price becomes clear, but for now a repeat of the previous pattern seems inevitable.

edit: I've added a second chart with an alt count at the bottom

Attached Image (click to enlarge)
Click to Enlarge

Name: Selection_045.png
Size: 65 KB


Attached Image (click to enlarge)
Click to Enlarge

Name: Selection_046.png
Size: 66 KB
cryptocurrency everytime
 
 
  • Post #4,065
  • Quote
  • Jun 7, 2014 9:44am Jun 7, 2014 9:44am
  •  lady_luck
  • | Joined Dec 2013 | Status: Member | 498 Posts
Quoting venzen
Disliked
My count yesterday was wrong - the ABC down is done and price is apparently in the cyan box - playing out a sideways 1-2. If this is the case we should complete wave (b) of (2) around 650 (at the upper TL) and then make the final C wave to complete 2 and begin advancing again. Alternatively, sideways consolidation drags out and another structure with other implications for price becomes clear, but for now a repeat of the previous pattern seems inevitable. {image}
Ignored
Good morning,

I agree with that. You mention a week to break out of the cyan box, may be a bit less,

Also I saw, last Danv chart https://www.tradingview.com/v/qm7cnu9V/ , which is a good illustration of either my "too very very bearish scenario" or your "worst of the downtrend about to begin".
Well, his previous chart on the idea had target at 800 and 1000.
Definitely two levels to watch for reversal, and so is 1600, at least in my book.
 
 
  • Post #4,066
  • Quote
  • Edited 3:29pm Jun 7, 2014 2:57pm | Edited 3:29pm
  •  venzen
  • Joined Jul 2011 | Status: good | 4,295 Posts
Quoting lady_luck
Disliked
{quote} Good morning, I agree with that. You mention a week to break out of the cyan box, may be a bit less, Also I saw, last Danv chart https://www.tradingview.com/v/qm7cnu9V/ , which is a good illustration of either my "too very very bearish scenario" or your "worst of the downtrend about to begin". Well, his previous chart on the idea had target at 800 and 1000. Definitely two levels to watch for reversal, and so is 1600, at least in my book.
Ignored
Hi lady_luck!

The counts in my previous posts are both wrong.

It just struck me right between the eyes: what you had identified as a cyan rectangle contains (in almost every case) a triangle.

The current triangle (at larger degree than the previous ones in this advance) is probably the last of wave "c" of D.

Who knows where this last wave up will target? 700? Your and KO's targets near 730? 870? 1600... (i hope not!)
cryptocurrency everytime
 
 
  • Post #4,067
  • Quote
  • Jun 7, 2014 3:10pm Jun 7, 2014 3:10pm
  •  venzen
  • Joined Jul 2011 | Status: good | 4,295 Posts
Attached Image (click to enlarge)
Click to Enlarge

Name: Selection_047.png
Size: 67 KB
cryptocurrency everytime
 
 
  • Post #4,068
  • Quote
  • Jun 7, 2014 4:14pm Jun 7, 2014 4:14pm
  •  lady_luck
  • | Joined Dec 2013 | Status: Member | 498 Posts
Quoting venzen
Disliked
{quote} Hi lady_luck! The counts in my previous posts are both wrong. It just struck me right between the eyes: what you had identified as a cyan rectangle contains (in almost every case) a triangle. The current triangle (at larger degree than the previous ones in this advance) is probably the last of wave "c" of D. Who knows where this last wave up will target? 700? Your and KO's targets near 730? 870? 1600... (i hope not!)
Ignored
Hi,

I saw your original post before the edit, there was some very good arguments.
I share your observation but my conclusions differ,
I'm seeing wave 1/2 everywhere. The only clear third followed by a triangle wave four was in april ' and september 13'.

For now 730, is only an intermediary target.
 
 
  • Post #4,069
  • Quote
  • Edited 6:58pm Jun 7, 2014 6:46pm | Edited 6:58pm
  •  venzen
  • Joined Jul 2011 | Status: good | 4,295 Posts
Quoting lady_luck
Disliked
{quote} Hi, I saw your original post before the edit, there was some very good arguments. I share your observation but my conclusions differ, I'm seeing wave 1/2 everywhere. The only clear third followed by a triangle wave four was in april ' and september 13'. For now 730, is only an intermediary target.
Ignored
yes, i removed the bulk of that post but glad you saw it. We've communicated all of those thoughts and theories before (in December and January) and I believe there is a "magic ingredient" to Bitcoin - the details of which I don't want to discuss in public until it's better understood or analytically reproducable.

Your idea of 1-2's building up is interesting and in the light of this i can appreciate why you say 700 or 800 are just intermediary targets. However, any wave can extend only so many times before it runs to conclusion. There are 2 side-effects of this: 1) it prevents any other wave in the 5 wave sequence from also extending, and 2) the wave (or subwave) that runs to conclusion in 5 waves reveals its 3rd wave signature in MACD - basically momentum (which MACD measures) is highest in wave iii of 3.

The largest degree 3rd wave of an advance will have the highest MACD value and this indication can help us determine our whereabouts and count in a wave. By this technique I deduce that these cyan pattern triangles happen consistently after each subwave has topped out, so 1-2 of the next subwave, but they are not in a larger degree each time. In fact, the highest MACD value (wave 3 of the current wave up) occured on 26/27 May. Also, consider that this is a C wave so it will want to achieve 2.618 or 3.618 of wave A (since achieving 1.618 at current levels has left both bulls and bears in a non-commitant stupor). Yes it can go higher, but not outrageously like in a real advance.

800 and 850 are real targets on my chart, but going by the "right-look" and triangle balance of force, i think its possible that BTCe could touch 700 and reverse.

edit: and if price can climb on top of 700 then I wouldn't worry about 730 either: 800 would be my next minimum target
cryptocurrency everytime
 
 
  • Post #4,070
  • Quote
  • Jun 8, 2014 4:41am Jun 8, 2014 4:41am
  •  tostaky06
  • | Joined Apr 2014 | Status: Member | 101 Posts
The "magic ingredient" is De-Dollarization ... maybe cause US are broke and lie on everything ...
 
 
  • Post #4,071
  • Quote
  • Jun 8, 2014 5:30am Jun 8, 2014 5:30am
  •  emptymind
  • | Joined Dec 2013 | Status: Member | 457 Posts
Attached Image (click to enlarge)
Click to Enlarge

Name: up1.png
Size: 30 KB
 
 
  • Post #4,072
  • Quote
  • Edited 6:22am Jun 8, 2014 5:42am | Edited 6:22am
  •  venzen
  • Joined Jul 2011 | Status: good | 4,295 Posts
Quoting tostaky06
Disliked
The "magic ingredient" is De-Dollarization ... maybe cause US are broke and lie on everything ...
Ignored
hi tostaky06,

hey, you suggested the poll but you haven't voted yet?

Yes, Bitcoin itself is "Magic" and i learnt today that there actually is no bitcoin data structure... there are no objects called "bitcoin" being passed between buyers and sellers - amazing, huh? There are transactions and there are blocks of transactions, but bitcoin ownership is simply like a title deed or copyright ownership - the receiving address and amount is written in a transaction and your wallet private key proves ownership, but not an actual (or virtual) bitcoin in existence!

Your point about the Dollar and the US economic state... well, we never know the real facts nor the date and the time, but Bitcoin is definitely here to stay. So regardless of any nation or state or individual, let's trade BTC
cryptocurrency everytime
 
 
  • Post #4,073
  • Quote
  • Jun 8, 2014 6:49am Jun 8, 2014 6:49am
  •  tostaky06
  • | Joined Apr 2014 | Status: Member | 101 Posts
hi

I don't see the poll ...


I think US are broke :

US dollar was powerfull cause it was linked to gold
But Nixon had unlinked it
So they coulnd't make gold, but at this point they could make dollar to finance their futher war (vietnam ... )
I don't know what they did with gold, maybe corruption, whatever ...
http://www.dailymotion.com/video/x1u...onspiracy_news
Gold is gone ...
And maybe that's why lot of banker are making suicide dying ...
And maybe that's why the german hardly recovered 5 tons of gold, but it was not the one they send to US ...
Maybe that's why GS wanted to kill euro currency with lying on Grece ...
So if gold it's gone, what's the value of dollar ?? maybe 30 000 billon of debt ...


So whatever, my only fear is that BTC is a another trick from US ... but BTC is the best solution for that mess will never happen again ...

That's what i think, and i will keep all my BTC untill dollar will die ...

(sorry for my english, i am french ... )
 
 
  • Post #4,074
  • Quote
  • Jun 8, 2014 8:27am Jun 8, 2014 8:27am
  •  emmalee25
  • | Membership Revoked | Joined May 2014 | 100 Posts
Not my analysis but its really good!
Attached Image (click to enlarge)
Click to Enlarge

Name: khsBncr.png
Size: 386 KB
 
 
  • Post #4,075
  • Quote
  • Edited 1:02pm Jun 8, 2014 12:21pm | Edited 1:02pm
  •  lady_luck
  • | Joined Dec 2013 | Status: Member | 498 Posts
Quoting venzen
Disliked
{quote} signature in MACD - basically momentum (which MACD measures) is highest in wave iii of 3.
Ignored
For the momentum, I prefer the divergence between PPO and CMF. When CMF make a top and PPO a low it usually is a wave 2 and the beginning of a wave 3.
I remember having a similar discussion with Infintus a few month back, MACD has the problem to be relative. So when the MA break to far out the price range in a short period of time, it's impossible to read.
A good example is the weekly chart, where april 2013 failed to be identified as a wave 3.
On the other hand, by strictly looking at H4 macd, I can see why a five wave reading is possible. But since it depends on what comes next, it's hard to extrapolate.
Although, what I labelled "5" is very close to the "3", which could easily invalidate it.
http://i.imgur.com/Ezl58Tj.png


Quoting venzen
Disliked
{quote} By this technique I deduce that these cyan pattern triangles happen consistently after each subwave has topped out, so 1-2 of the next subwave, but they are not in a larger degree each time. In fact, the highest MACD value (wave 3 of the current wave up) occured on 26/27 May.
Ignored
I also think those 1/2 are of smaller degree.
On H1, macd failed to call a higher top since the move at the end of may. In fact the april's top at 540, which happen in a shorter time is still the highest value on MACD.
And the PPO is confirming smaller degree.

http://i.imgur.com/YF3XSTH.png

In conclusion, their is two possibility.
We are now entering an extended fifth to conclude this move up.And the highest MACD divergence will confirm the top of wave 3 at the end of may.
Or we are now starting wave (iii) of iii of 3 which will overtake every previous high on MACD.

edit : In both perspective, this is where the previously observed pattern shall change. The way it does, will tell us a lot
 
 
  • Post #4,076
  • Quote
  • Edited 2:12pm Jun 8, 2014 1:59pm | Edited 2:12pm
  •  venzen
  • Joined Jul 2011 | Status: good | 4,295 Posts
Quoting lady_luck
Disliked
{quote} For the momentum, I prefer the divergence between PPO and CMF. When CMF make a top and PPO a low it usually is a wave 2 and the beginning of a wave 3. I remember having a similar discussion with Infintus a few month back, MACD has the problem to be relative. So when the MA break to far out the price range in a short period of time, it's impossible to read. A good example is the weekly chart, where april 2013 failed to be identified as a wave 3. On the other hand, by strictly looking at H4 macd, I can see why a five wave reading is possible....
Ignored
you said it all, lady_luck.

All I'd like to add is to mention the phenomenon whereby MACD shows different relative momentum at different timeframes. Some degrees are better analyzed at 15min and larger degree waves at 1hr or 4hrs, etc. For this advance I'm finding 15min TF to give me the best intraday signals - but that is with my custom faster settings on MACD - so may not be the case for you or everyone. PPO and CMF - this is new and I will learn more about it asap.

Yes, we have to wait and see what happens in this next (5th) wave up. I'll be watching the angle of ascent and MACD - although the thing with extensions is that they just keep pushing until the last minute and suddenly you have a new MACD high and a new count! If this is an impulse wave C to April's wave A then it shouldn't extend because its function is not to push the advance but to satisfy the correction. So, what happens above 700 and the size and frequency of cyan patterns will reveal a lot.

This wave up has been very informative and the way it started is the way it has continued. I must say, Bitcoin price resembles the way Gold moves - a lot - and it has a distinct pattern but cunning way of throwing in variation just when you think the previous pattern is 100% sure to repeat!
cryptocurrency everytime
 
 
  • Post #4,077
  • Quote
  • Edited 2:53pm Jun 8, 2014 2:13pm | Edited 2:53pm
  •  lady_luck
  • | Joined Dec 2013 | Status: Member | 498 Posts
Quoting venzen
Disliked
{quote} you said it all, lady_luck. All I'd like to add is to mention the phenomenon whereby MACD shows different relative momentum at different timeframes. Some degrees are better analyzed at 15min and larger degree waves at 1hr or 4hrs, etc. For this advance I'm finding 15min TF to give me the best intraday signals - but that is with my custom faster settings on MACD - so may not be the case for you or everyone. Yes, we have to wait and see what happens in this next (5th) wave up. I'll be watching the angle of ascent and MACD - although the thing...
Ignored


It always fascinates me, how the same argument can support some very different analysis Next week will be very interesting

edit : to be honest I don't use PPO, CMF, RSI, Stock, AO or even MACD that much for "forecasting", but they can be good tool to "look back". And I don't think their is much article about their relation with EW..
PPO is useless to identify a wave 3. But pretty good at giving tops.
CMF is good at anticipating strong move, such as an extended fifth or a third.
Those two indicator can work together because their value are both absolute. When they crosses and a volume spike follow with a divergence on RSI, it can translate the fear before a wave A and the greed before a wave 3.
Unfortunately it stays a very contextual observation solely dependent on what your EW interpretation of the previous move is.
 
 
  • Post #4,078
  • Quote
  • Jun 8, 2014 11:31pm Jun 8, 2014 11:31pm
  •  venzen
  • Joined Jul 2011 | Status: good | 4,295 Posts
Quoting lady_luck
Disliked
{quote} It always fascinates me, how the same argument can support some very different analysis Next week will be very interesting edit : to be honest I don't use PPO, CMF, RSI, Stock, AO or even MACD that much for "forecasting", but they can be good tool to "look back". And I don't think their is much article about their relation with EW.. PPO is useless to identify a wave 3. But pretty good at giving tops. CMF is good at anticipating strong move, such as an extended fifth or a third. Those two indicator can work together because...
Ignored
As I'm looking at the charts this morning it looks to me like trend is turning down... keeping an eye on this possibility.
cryptocurrency everytime
 
 
  • Post #4,079
  • Quote
  • Jun 9, 2014 8:55am Jun 9, 2014 8:55am
  •  KiwiOz
  • | Commercial Member | Joined Sep 2013 | 2,502 Posts
Quoting venzen
Disliked
{quote} As I'm looking at the charts this morning it looks to me like trend is turning down... keeping an eye on this possibility.
Ignored
Hi venzen....Still targeting 555....
Attached Image (click to enlarge)
Click to Enlarge

Name: btcusddaily.png
Size: 37 KB
Shit Happens
 
 
  • Post #4,080
  • Quote
  • Jun 10, 2014 2:47am Jun 10, 2014 2:47am
  •  dswk
  • Joined Feb 2006 | Status: Pips Pod... | 1,611 Posts
Quoting KiwiOz
Disliked
{quote} Hi venzen....Still targeting 555.... {image}
Ignored
Agreed.
Not a lot of change since then but targeting zone 550 at least. i will reevaluate if we broke higher price before this target (> 675). All prices from BTC-e.
Attached Image (click to enlarge)
Click to Enlarge

Name: btcusd-d1-distel-enterprise.png
Size: 50 KB
 
 
  • Interactive Trading
  • /
  • Bitcoin technical analysis
  • Reply to Thread
    • 1 202203Page 204205206 504
    • 1 Page 204 504
1 trader viewing now
  • More
Top of Page
  • Facebook
  • Twitter
About CC
  • Mission
  • Products
  • User Guide
  • Blog
  • Contact
CC Products
  • Forums
  • Calendar
  • News
  • Coins
  • Market
CC Website
  • Homepage
  • Search
  • Members
  • Report a Bug
Follow CC
  • Facebook
  • Twitter

CC Sister Sites:

  • Metals Mine
  • Energy EXCH
  • Forex Factory

Crypto Craft® is a brand of Fair Economy, Inc.

Terms of Service / ©2023