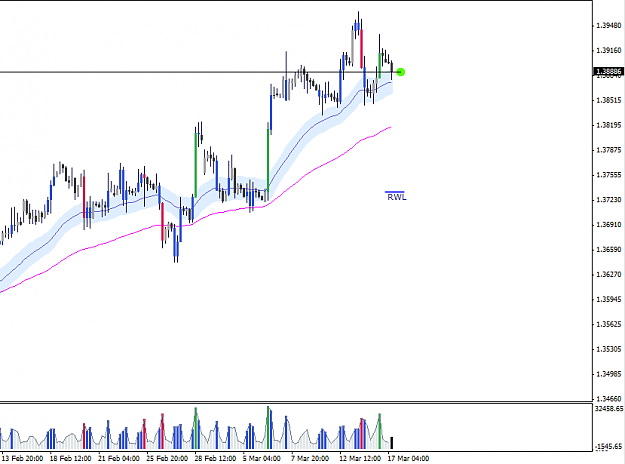
Starting a journal for a strategy that focuses on making all entries as low-risk as possible. I'm using the Sonic system template found on this thread. All entries are based on the 5 minute timeframe, however I use top-down analysis to keep an eye on the bigger picture.
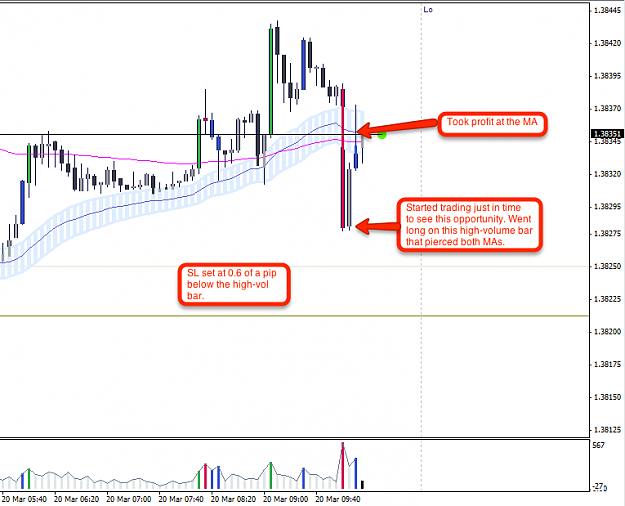
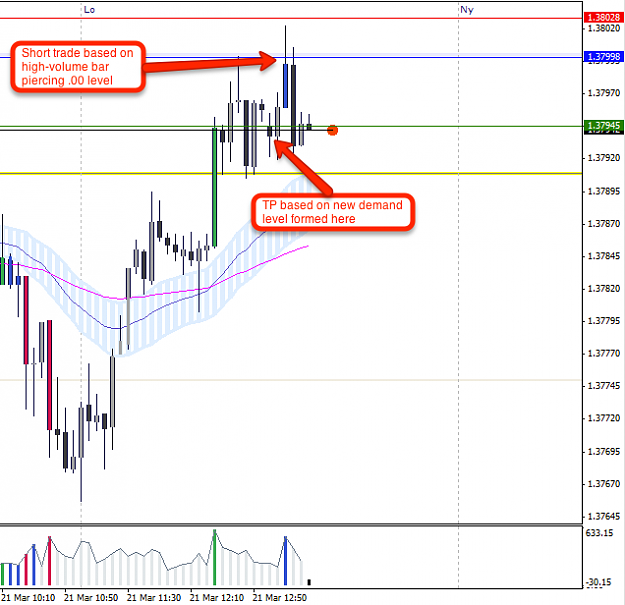
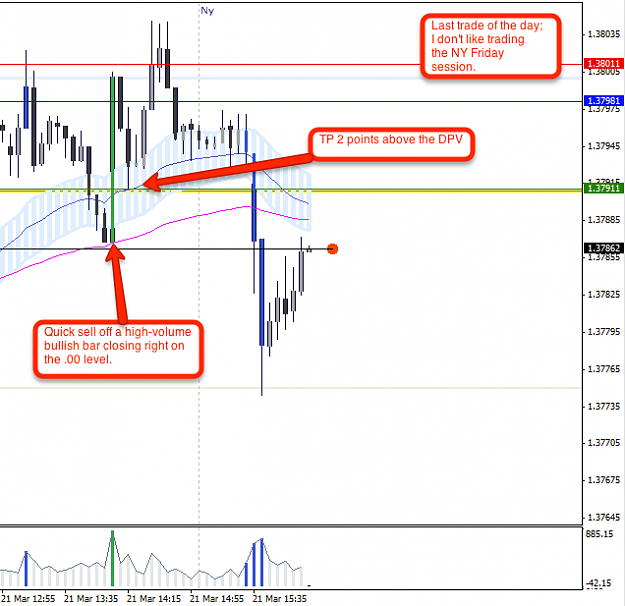
I'll keep it nice and simple, blue lines on charts are entries, green lines are TP and red lines are SL. I don't think about TP targets at all - I'll usually just close the trade at the first point where it is possible the price could turn around again. My SL is always placed at half a pip beyond the reversal pattern I've based the trade on.
The only thing I'm thinking about for entries is trying to make my entry as close as I possibly can to that SL. I'm trying to only take really good entries and ignore average ones that could still work. Once I'm up at least 1% for the day I'm even stricter about the quality of entries I'll take.
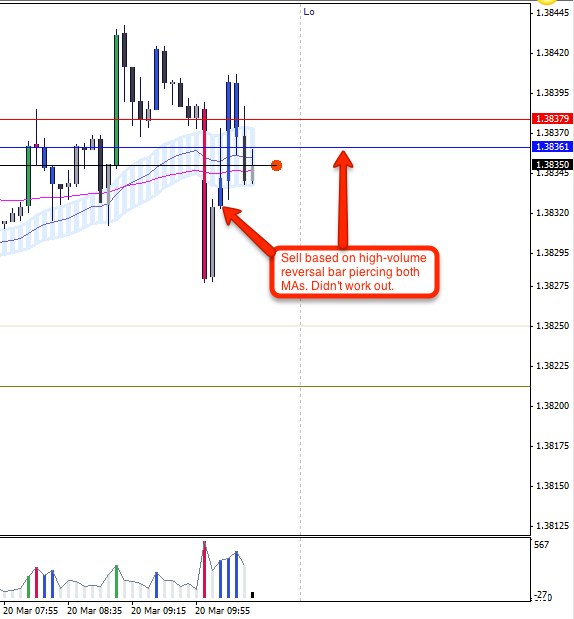
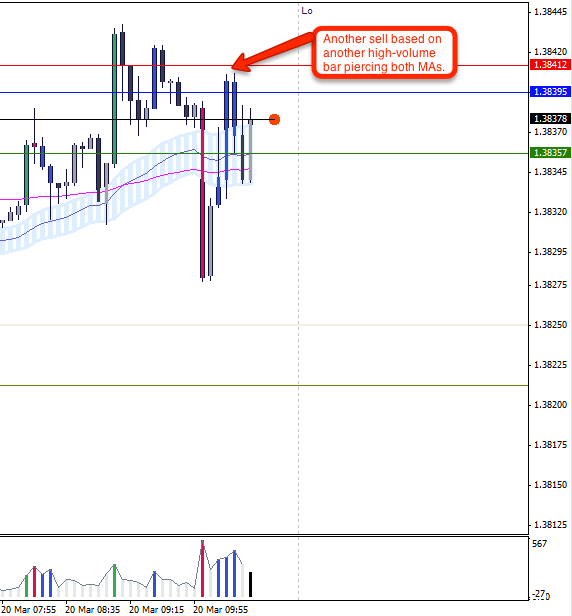
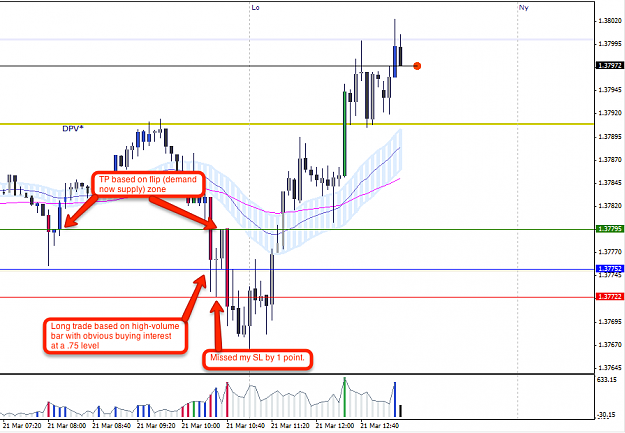
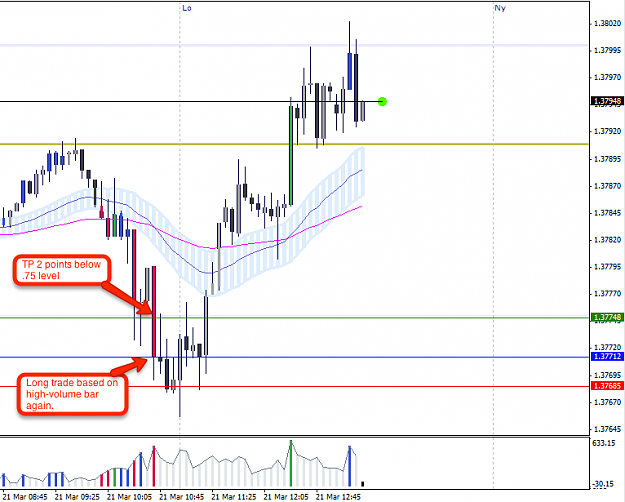
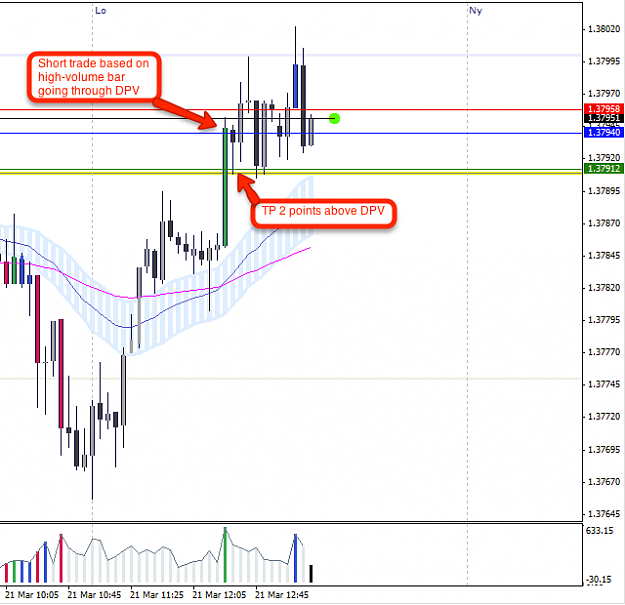
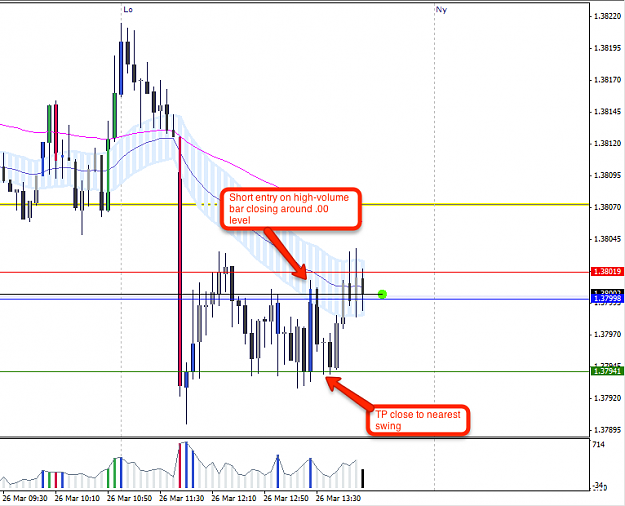
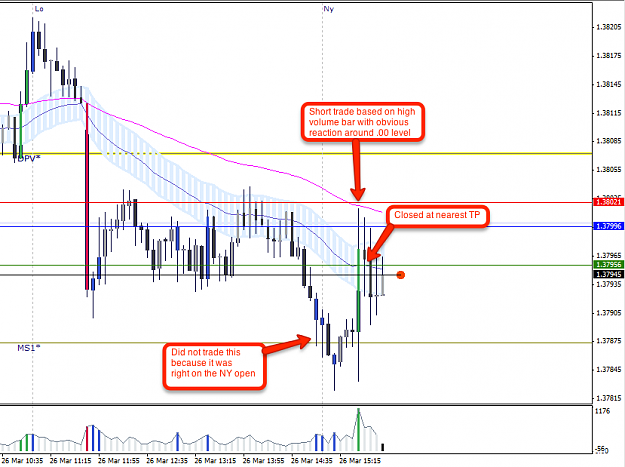
03/26 EDIT: Over time I've refined the entry process and will usually have a specific technical basis for trades that I tend to not stray from. Typically I will wait for a high-volume (blue, red or green) bar that closes very close to a round level or support/resistance level. Sometimes I'll also use supply and demand zones as a base for my trades, but always with a high-volume bar. I'll also take a trade if a high-volume bar shows an obvious reaction to an area on a chart and is favourable for entry in terms of risk. Minimising risk is still my top priority and I'll only take trades if the price returns to within 3 pips of my SL above or below the high-volume bar (red line on the charts).
A Quick Note:
Many of the trades on this first page, particularly in the first posts are trades that I would do quite differently now as my strategy has developed. The entry rules in the above edit are how I usually enter trades now.
Here's all the trades from the first week of testing.
Week 1
Day 1 - March 4th 2014
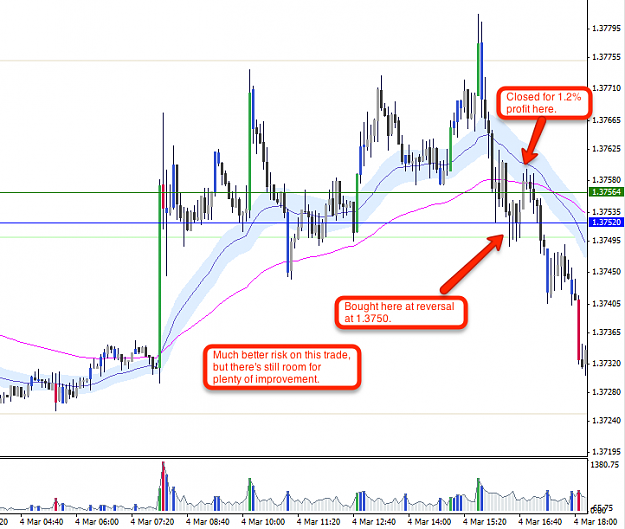
#1: SELL @ 1.37514, closed at 1.37490 for a 0.5% profit.
#2: SELL @ 1.37575, closed at 1.37509 for a 1.9% profit.
#3: BUY @ 1.37520, closed at 1.37564 for a 1.2% profit.
Day 2 - March 5th 2014
#1 BUY @ 1.37244, closed at 1.37317 for a 2.0% profit.
Day 3 - March 6th 2014
#1 BUY @ 1.37248, closed at 1.37277 for a 0.7% profit.
#2 SELL @ 1.37408, closed at 1.37431 for a 0.9% loss.
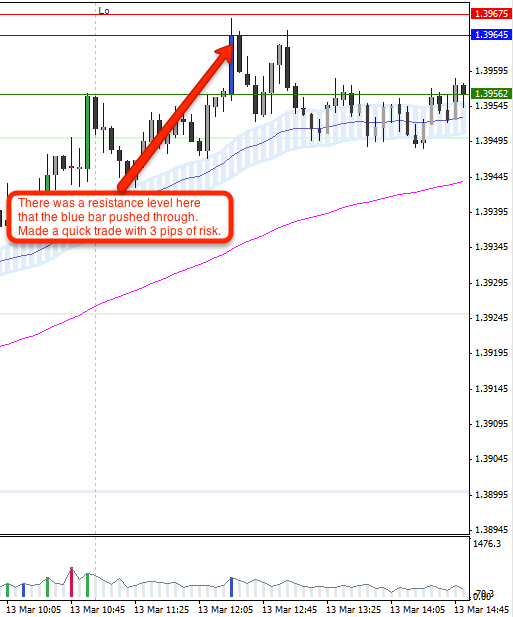
#3 BUY @ 1.37395, closed at 1.37445 for a 1.3% profit.

Day 4 - March 7th 2014
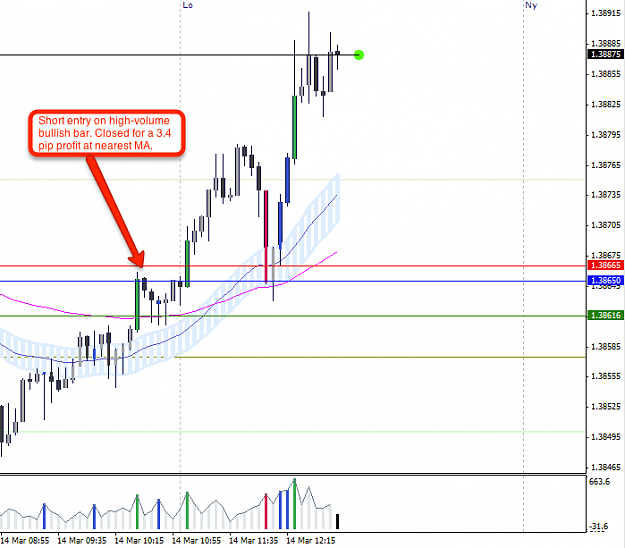
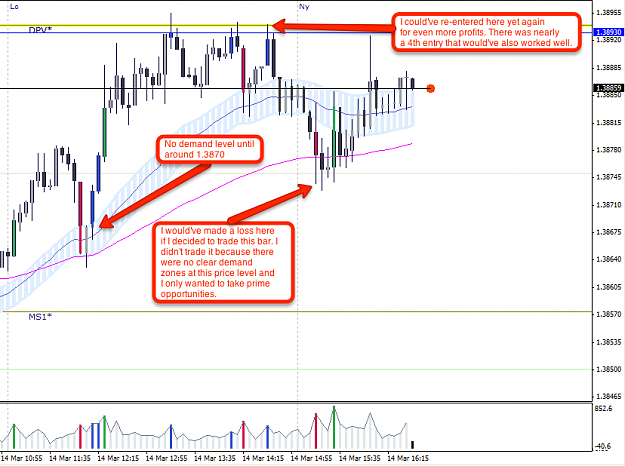
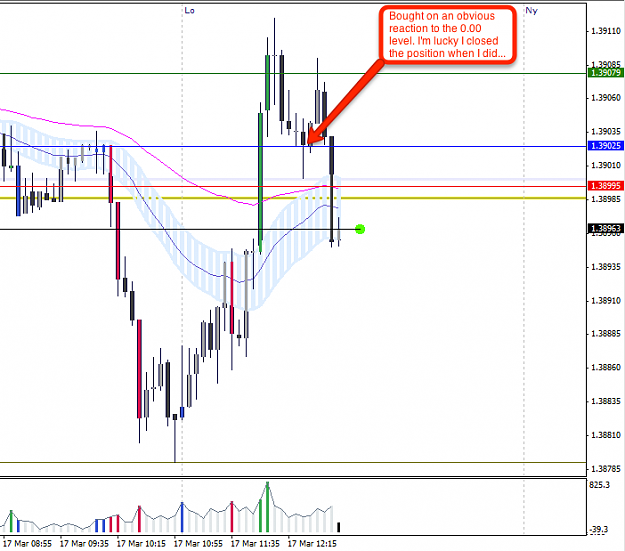
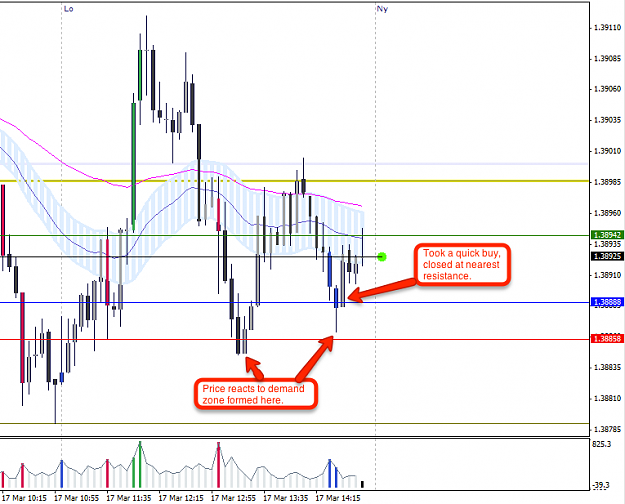
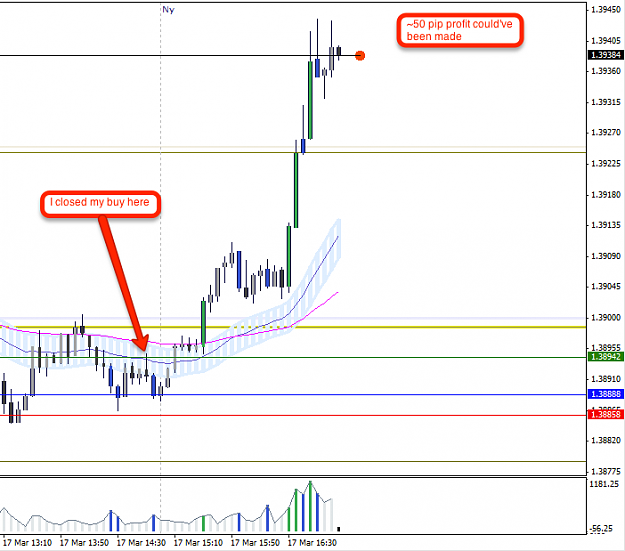
#1 BUY @ 1.38666, closed at 1.38707 for a 1.0% profit.

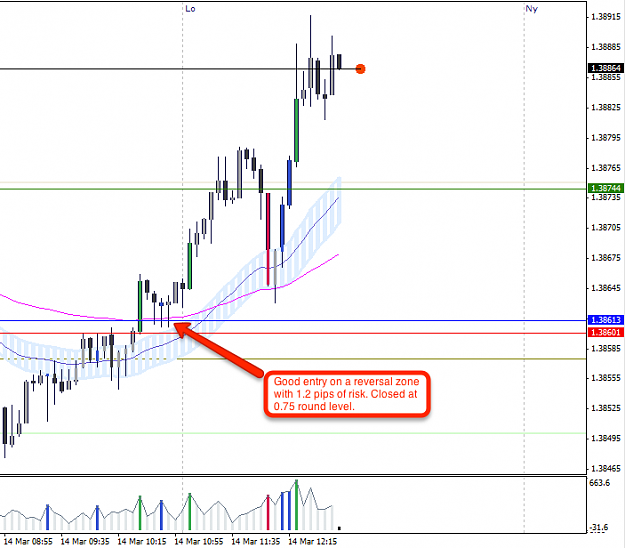
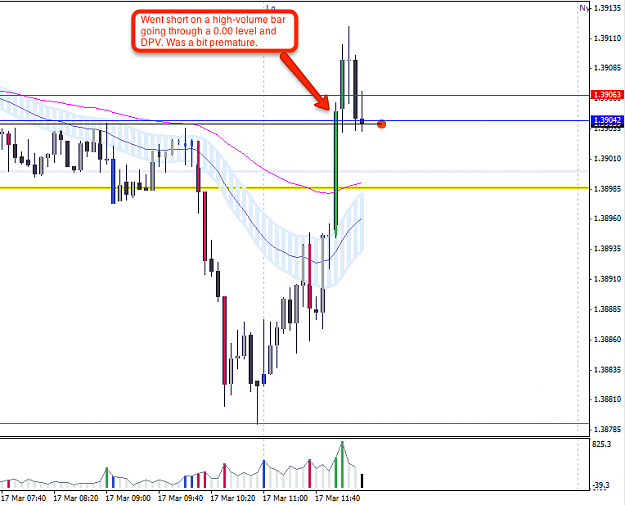
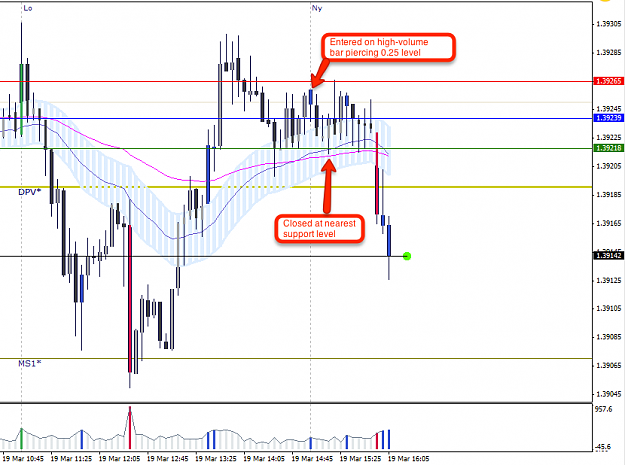
#2 SELL @ 1.39047, closed at 1.39070 for a 0.9% loss.

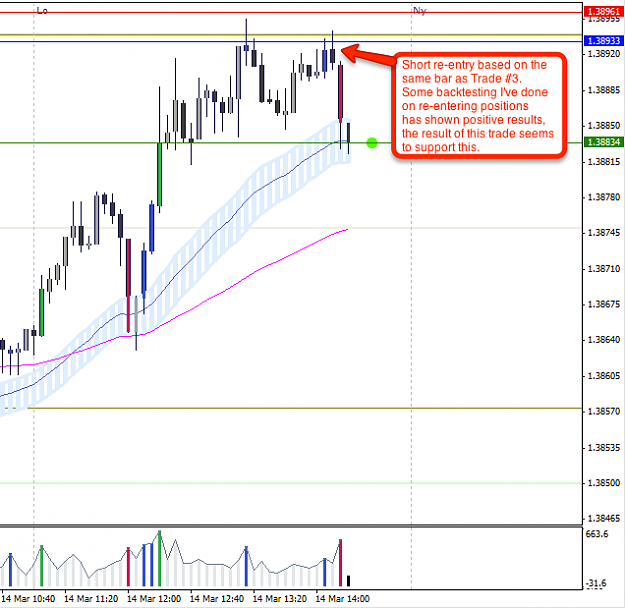
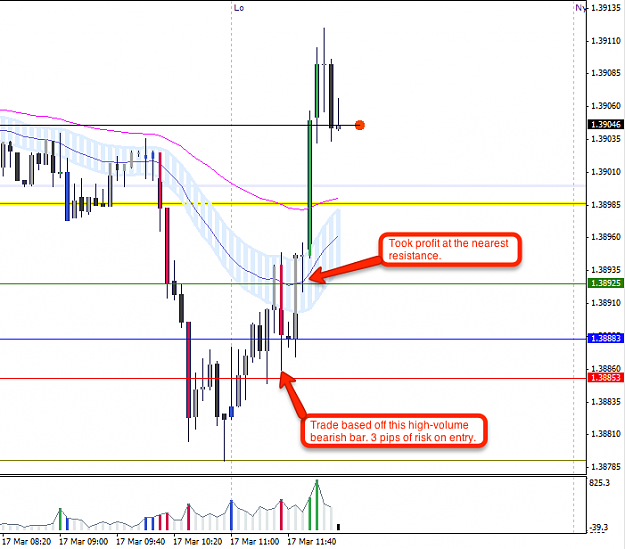
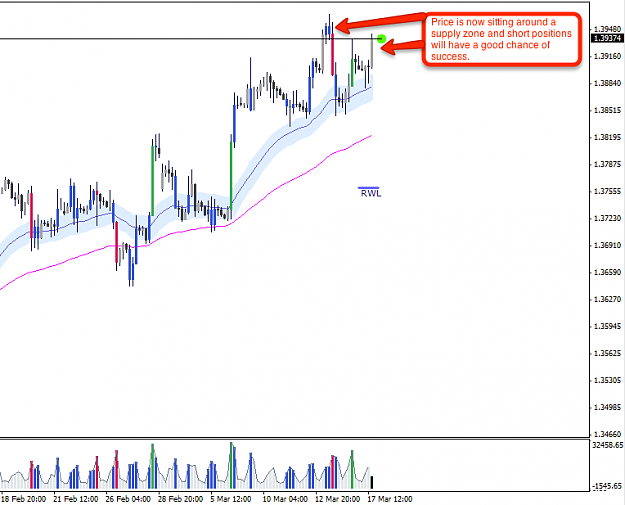
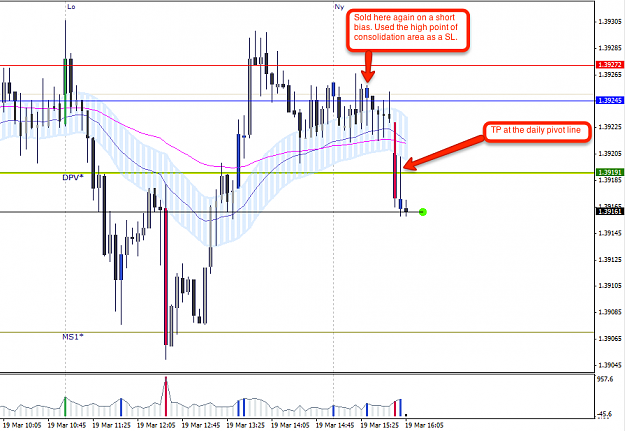
#3 SELL @ 1.39133, closed at 1.39075 for a 1.5% profit.
Week Summary
% Gain for the Week: 8.55%
Average Daily Gain: 2.1%
Maximum Consecutive Drawdown: 0.9%
I'll keep it nice and simple, blue lines on charts are entries, green lines are TP and red lines are SL. I don't think about TP targets at all - I'll usually just close the trade at the first point where it is possible the price could turn around again. My SL is always placed at half a pip beyond the reversal pattern I've based the trade on.
The only thing I'm thinking about for entries is trying to make my entry as close as I possibly can to that SL. I'm trying to only take really good entries and ignore average ones that could still work. Once I'm up at least 1% for the day I'm even stricter about the quality of entries I'll take.
03/26 EDIT: Over time I've refined the entry process and will usually have a specific technical basis for trades that I tend to not stray from. Typically I will wait for a high-volume (blue, red or green) bar that closes very close to a round level or support/resistance level. Sometimes I'll also use supply and demand zones as a base for my trades, but always with a high-volume bar. I'll also take a trade if a high-volume bar shows an obvious reaction to an area on a chart and is favourable for entry in terms of risk. Minimising risk is still my top priority and I'll only take trades if the price returns to within 3 pips of my SL above or below the high-volume bar (red line on the charts).
A Quick Note:
Many of the trades on this first page, particularly in the first posts are trades that I would do quite differently now as my strategy has developed. The entry rules in the above edit are how I usually enter trades now.
Here's all the trades from the first week of testing.
Week 1
Day 1 - March 4th 2014
#1: SELL @ 1.37514, closed at 1.37490 for a 0.5% profit.
#2: SELL @ 1.37575, closed at 1.37509 for a 1.9% profit.
#3: BUY @ 1.37520, closed at 1.37564 for a 1.2% profit.
Attached Image (click to enlarge)
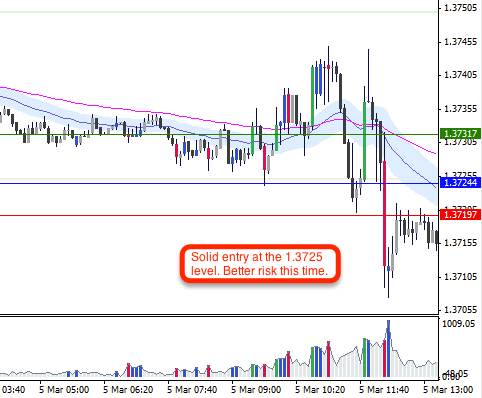
Day 2 - March 5th 2014
#1 BUY @ 1.37244, closed at 1.37317 for a 2.0% profit.
Attached Image
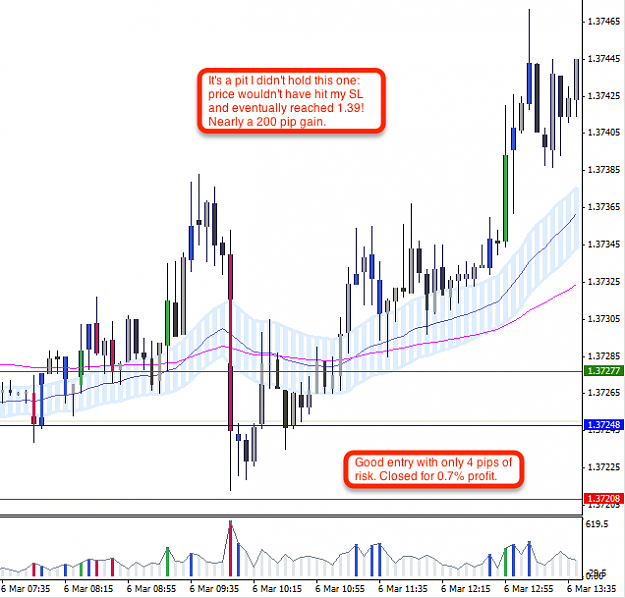
Day 3 - March 6th 2014
#1 BUY @ 1.37248, closed at 1.37277 for a 0.7% profit.
Attached Image (click to enlarge)
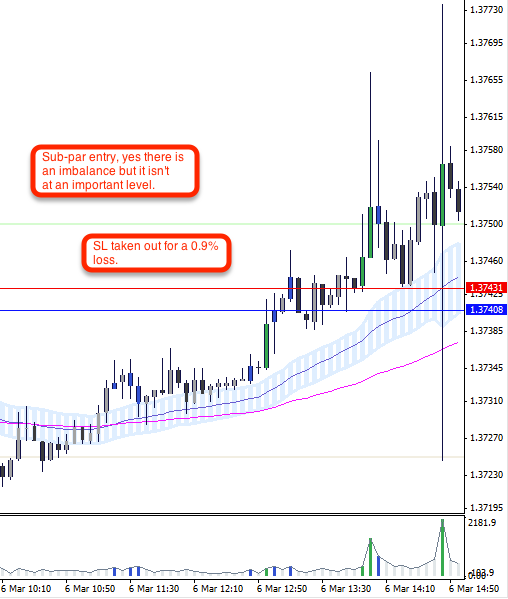
#2 SELL @ 1.37408, closed at 1.37431 for a 0.9% loss.
Attached Image
#3 BUY @ 1.37395, closed at 1.37445 for a 1.3% profit.
Attached Image
Day 4 - March 7th 2014
#1 BUY @ 1.38666, closed at 1.38707 for a 1.0% profit.
Attached Image
#2 SELL @ 1.39047, closed at 1.39070 for a 0.9% loss.
Attached Image
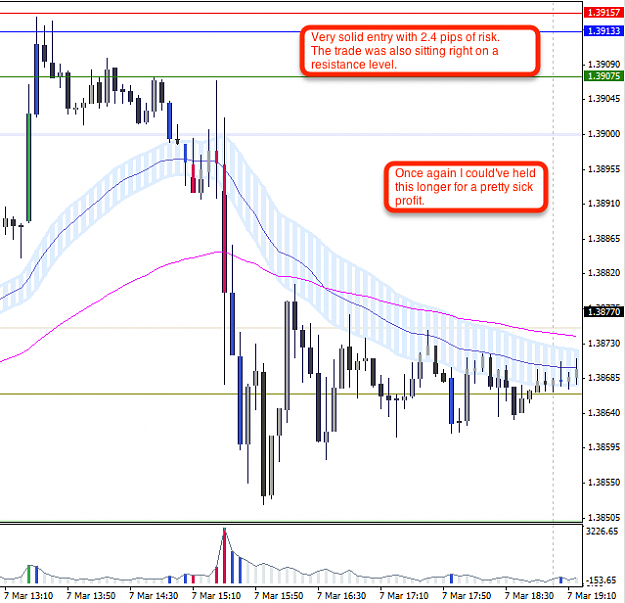
#3 SELL @ 1.39133, closed at 1.39075 for a 1.5% profit.
Attached Image (click to enlarge)
Week Summary
% Gain for the Week: 8.55%
Average Daily Gain: 2.1%
Maximum Consecutive Drawdown: 0.9%
Understanding yourself is synonymous with understanding the markets.