Animal Farm.
Read the book and figure out who the pigs are. Let’s make some pork chops.
Please note that there is an error on post # 264 on page 14.
Here is how it should read:
"The first rule is:
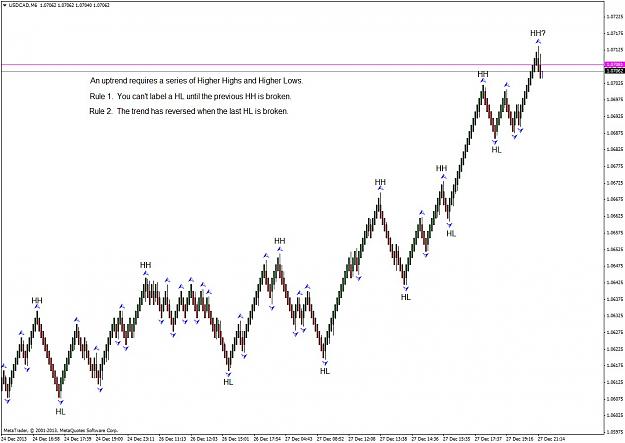
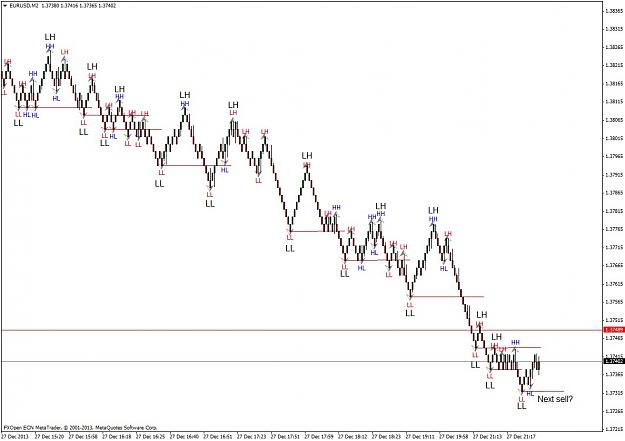
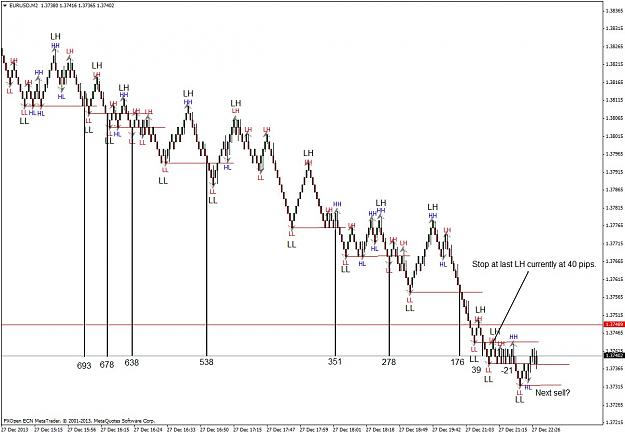
A new LH cannot be identified until price moves past the previous low.
A new HL cannot be identified until price moves past the previous high.
To make charts easier to interpret this, I use Bill Williams Fractals to identify the LL LH HH LH turns in the market."
*******************************************************************************************************************************
This thread is a place where we can try to develop some new ideas for trading Renko, particularly Median Renko Charts.
I have read over the other Renko Threads on Forex Factory and as I like to give credit where it is due I suggest that anyone who has little or no knowledge of Renko gives those threads a visit and studies the materials there.
I will cite sources for any tools that I use here, particularly the various eas that can be used to draw Renko Charts on MT4. In doing so, I thank the programmers who have labored over these and salute them for sharing so generously.
I am not a person who particularly likes indicators. I would rather develop my own understanding of price action to the point where I don’t need a lagging indicator or, worse yet, many of them. Price is what I use to make my decisions with. Having said that I do have indicators on my chart for two reasons:
1. I like an indicator that helps me determine if I am in a trend or a counter-trend move.
For this, I use a 5 34 5 MACD, with a 5 period EMA superimposed on it. I like the 5 34 5 MACD because I can use it to count Elliott Waves. More simply it is used to easily identify trend and counter trend moves. I am a big fan of Elliott Wave Theory but I will really simplify that, just as Renko simplifies a lot of things.
If you have Elliott Wave issues I sympathize. I see so much Elliott Wave Analysis by people who are just bull artists, and the whole subject gets a bad name. I use Elliott Wave analysis; it is not a simple topic. I will try to make it very simple. If you object to Elliott Wave move on. If you have an open mind, let’s see what I can teach you. I will say right now, that I am not here to debate the topic of Elliott Wave with naysayers. It is very useful to me. If you have an issue with that - go somewhere else.
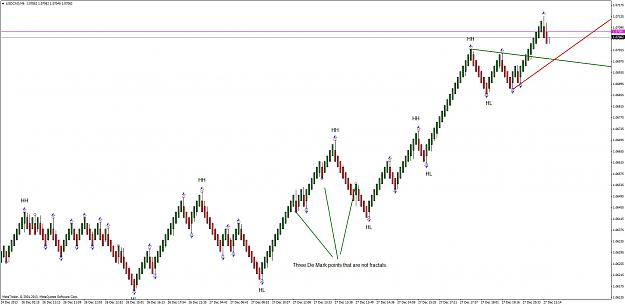
2. The De Mark/Mouteki indicator draws Trend lines that are appropriate.
You can soon draw these trend lines properly yourself and the De Mark Indicator is no longer needed. It is nice to keep it around as it does some work for you and it also sounds an alert. It also locates Fractals and some pivots. Fractals are really magical but again, like Elliott Wave, a lot of people don’t understand Fractals.
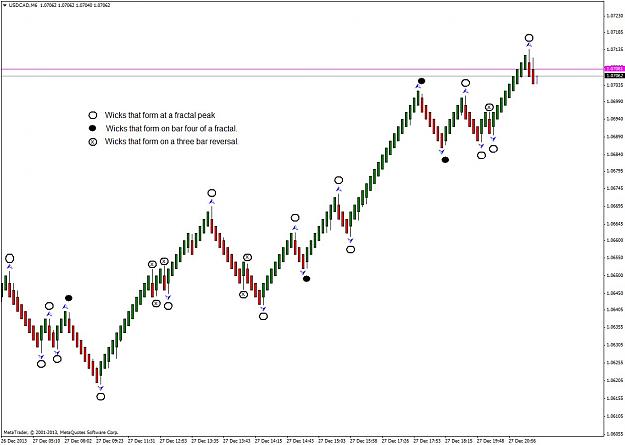
3. Fractals. Chart decorations or symbols that draw your attention to important places on the chart? You can easily train your eyes to find Fractals and pivots on any chart, including Renko charts. Do you need to have them drawn on the chart? Personally, I am trying to get away from all the tree ornaments that people hang all over their charts. I think that in due course that the fractal indicator will no longer be needed on your charts. Your choice anyway.
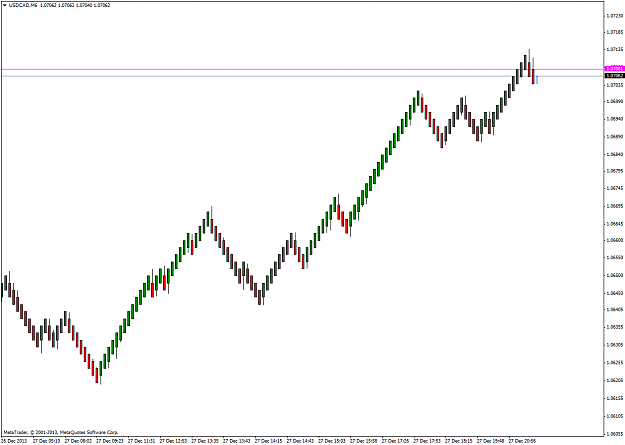
4. Renko. Anything on a chart that is not price is superfluous in my opinion. Renko is purely price.
I have no doubt that people will turn up with all kinds of indicators.
Here is something that I would urge all traders to try. I think of it as the acid test for indicators. It is from page 85 of Bill Williams’ book, “New Trading Dimensions.”
“It is possible to trade profitably using only this oscillator and without even knowing what the current price is. … Think about other trader’s reactions when you say that you can trade profitably without even looking at the price chart or asking the current price.”
I have been at this for a long time and I have developed a lot of indicators and tested hundreds more. If you have an indicator that meets the above standard it will be of interest, otherwise it is not.
Final word on indicators:
Later, I will use indicators that give an alert at places or conditions on the chart where I need to pay attention. I am a busy person and I do not want to sit and stare at a computer waiting for something to happen. I like to hear a preliminary alert and then a confirming alert that tells me a trade opportunity has arrived. I think of these more as alert systems than indicators.
I will get to those alerts, but not yet; one step at a time.
******************************************************************************************************************************
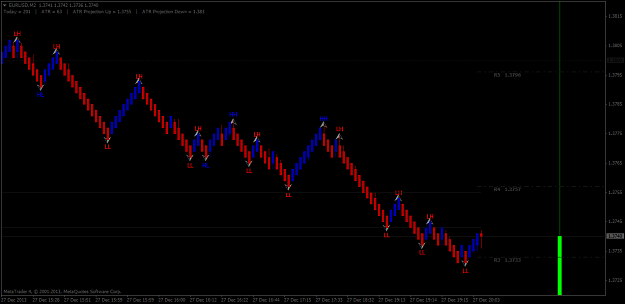
5 34 5 MACD with a 5 EMA superimposed for analysis.
De Mark Trend Lines and Renko for trading signals.
Fractals at turning points.
Eventually it will just be the Renko chart, the MACD and a couple of alerts that prove to be useful and your brain.
******************************************************************************************************************************
Indicators, scripts, templates and PDF files will all be posted here:
Some good scripts, to help manage the trades:
Clean up all objects. Close and reverse. Close all orders specific pair.
(Additional scripts will be added later.)
Optional:
Profit Tracker. To keep track of how we are doing.
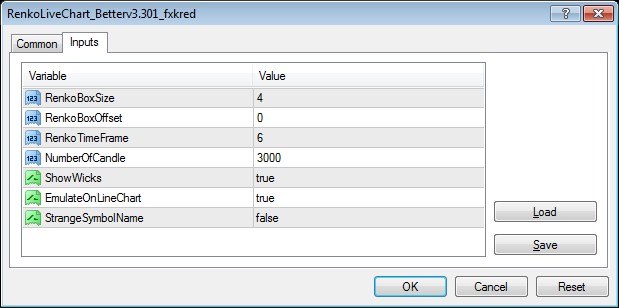
Attached File(s)