It started when I tried to find a winning strategy. Look over here look over there. Try this try that. Til I came to this. Maybe there is NO holy grail. But what about the system I'm working on lately; checking up the DAILY price moving average, and take action, which I called Holy Cross
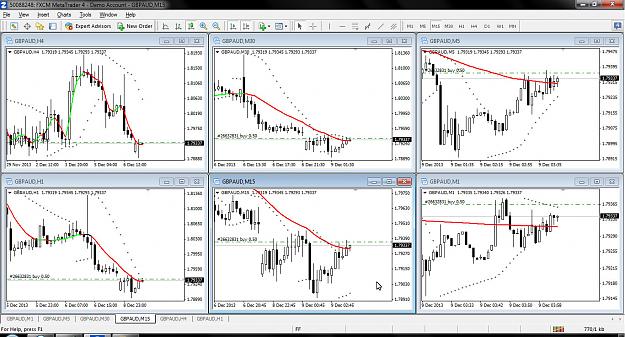
The Setup as chart (sample) below:
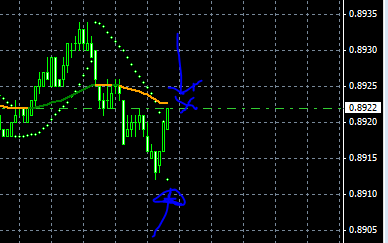
1. LWMA; I use AllAverages.ex4 because it tells me direction of trend.
Attach on each chart with the default Timeframe = 0, Price = 6, MA_Shift = 0, MA_Method = 3, ....
.... but MA_Period value: M1 = 720, M5 = 144, M15 = 48, M30 = 24, H1 = 12, H4 = 3. The values on each are the DAILY calculation divided by 2 (two); for early warning.
Price = 6 : Weighted Close (HLCC/4), and MA_Method = 3 : Linear Weighted (http://www.onlinetradingconcepts.com...AWeighted.html).
2. Default Parabolic SAR (http://www.onlinetradingconcepts.com...bolicSAR2.html).
The Indicator
AllAverages_v2.1 cc.ex4 http://www.forexfactory.com/attachme...6&d=1320348682
What to look:
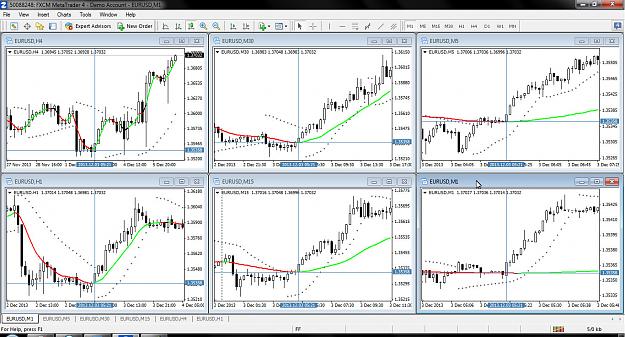
- H4 chart to see the big picture; Up or down trend by the look at the LWMA direction (green is up, red is down).
- Look at M1, is the trend major or minor*. Major trend would be better, or you will miss a lot of opportunities to make big profits.
- Determine the current trend from M1 chart.
- You should open position when the price cross the LWMA line on EACH timeframe.
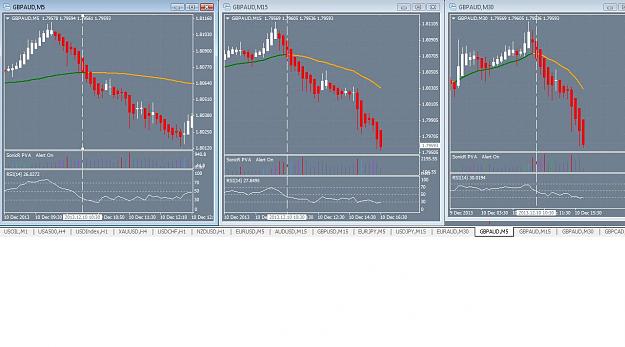
- I use PSAR for the stop only (watch on M5 chart), but it could be the confirmation to open position only if the PSAR at the same point on every chart (it's a MUST on H1 and M15, do NOT trade against).
*Major uptrend is when the price above the LWMA while LWMA line is sloping up (green). Minor uptrend is when the price below LWMA while LWMA line is sloping up (green). Major downtrend is when the price below the LWMA while LWMA line is sloping down (red). Minor downtrend is when the price above LWMA while LWMA line is sloping down (red).
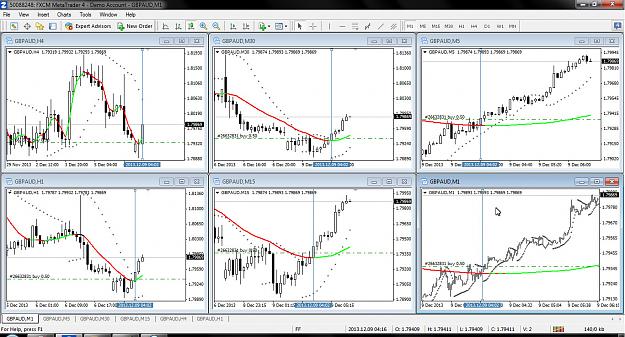
And so wether it long or short...
Entry Point : price crossing LWMA line on each timeframe (M1, M5, M15 and confirm by the higher timeframe so can gain more pips). Check the blue vertical and horizontal line on the chart.
Take Profit : you can set 15 pips per trade, or you can wait for stop and reversal (PSAR) on M15 chart to show up, or you can decide for yourself.
That's it.
Need help with opinions or suggestions so this system's worth while.
Thank you, FF. Thank you all. And sorry for english.