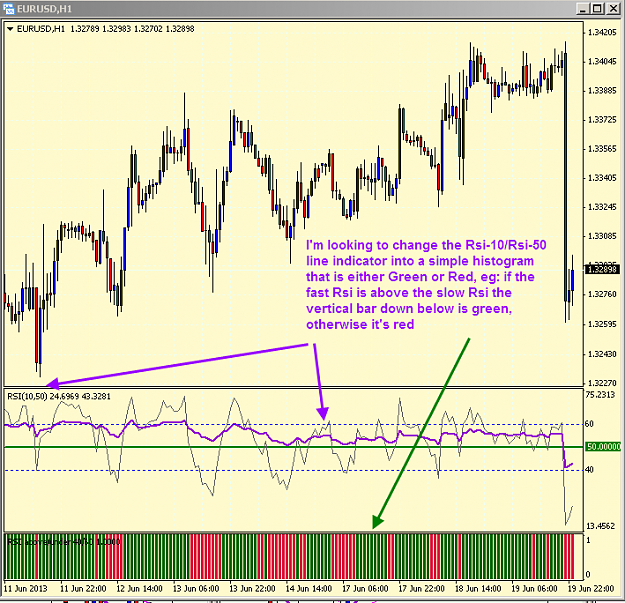
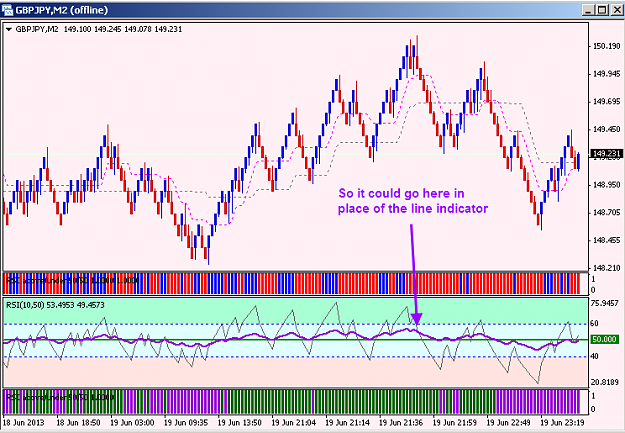
I'm looking to replace an Rsi-10/Rsi-50 line indicator on some charts with a Histogram that will show a Green vertical when the fast Rsi is above the Slow Rsi and a Red bar when it is below. It should also be easy to change the look-back periods and the colors by the user.
I've attached 2 charts for to help better see what I'm trying to do.
I've also included the code I'm using now for the Rsi-10/Rsi-50 line indicator as well as the histogram for
Rsi-50 above/below 50%, in case it's useful.
Thanks for any help.
I've attached 2 charts for to help better see what I'm trying to do.
I've also included the code I'm using now for the Rsi-10/Rsi-50 line indicator as well as the histogram for
Rsi-50 above/below 50%, in case it's useful.
Thanks for any help.
Attached Image(s) (click to enlarge)
Attached File(s)