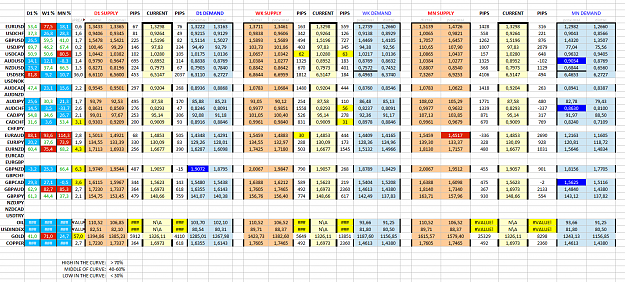
The Supply and Demand spreadsheet that can be downloaded from this thread, was created with the goal of having a quick snapshot of where the currency pairs I'm trading every day are located in the Daily and Weekly Demand and Supply Curve.
I believe that knowing where you are located in the supply and demand curve is key to have success in the markets. After all what we all want to do is "buy low" and "sell high" in order to increase our odds and obtain as much benefits as we can from the supply and demand imbalances in the markets.
This spreadsheet could be much better if I had the programming skills, but so far it's an amateur trial to obtain BID/ASK prices from Metatrader by using DDE Server, that's all. The other calculations, changing cells' background colors, calculating how low or high price is in the curve, etc, are all done based on BID/ASK prices and manually entered proximal and distal lines for D1 and WK supply and demand levels.
There is also a png attachment that will give you a quick visual look of what the spreadsheet for supply/demand looks like.
WHAT IS A DISTAL LINE? WHAT IS A PROXIMAL LINE?
An area of supply or demand is not just a single price/line (like classic support/resistance), but a zone/area composed of a number of pips. The highest part of that (rectangle) is the distal line, that is, the highest price in the zone. The lowest part of that rectangle is the proximal line, which is the lowest and the closest to current price.
- The closer you are to the a supply area, the better for selling or exiting your long positions
- The closer you are to the a demand area, the better for buying or exiting your short positions
The sole purpose of this spreadsheet is to allow you to know how high or low you are in the D1 and WK supply and demand curve if you manually add the distal and proximal lines for both D1 and WK SD levels on your charts, or whatever timeframe you want to use as the curve (demand and supply in control of current price)
All proximal and distal lines prices are manually entered, you can change them and the spreadsheet will do all the calculations for you. Levels might differ depending on brokers and of course depending on what you consider to be the demand and supply areas in control of price at any given moment.
Drawing supply and demand levels can be considered an art. You might see levels everywhere if you are new to supply and demand, with time you will have to create very simple and strict rules to filter the bad ones out as much as possible.
Features of this spreadsheet:
• There are 2 different areas to display D1 and WK Supply/Demand D levels. They are displayed between current price zones
• You can use other timeframes like H1, H4 as the curve. You just have to add the prices for the H1/H4 levels that you found and the spreadsheet will do the calculations for you. In other words, you can use any timeframe, spreadsheet has been created to have room for 2 timeframes, so you can use D1/WK, H1/H4, any 2 timeframes combination
• Each supply and demand area is composed of these fields: current price, % location in the curve, distal price and proximal price
• PIPS left for proximal line to be hit. These are the 2 pips fields located to both sides of current price
• It will calculate how low or high we are in the D1 and WK curve in the form of a %. The higher the better for selling, opposite for buying
CONDITIONS AND CELL HIGHLIGHTING
There are a few conditions that will change the look of any given cell in order to visually help you distinguish what is going on with all the currency pairs.
• Percentages, curve % or altitude (how high or low in the curve) are calculated by using the proximal lines, a simple subtraction
• SD level about to be hit. If current price is between 0 to 40 pips from hitting the proximal line of a SD level, the pip cell will be highlighted to yellow
• SD level broken. If current price is higher than the distal line, the cell will be highlighted in Purple. This will mean that the SD area has been broken
• SD level has been hit, price is within the level. If current price has hit the proximal line, the proximal line cell will be highlighted in Red. This will mean that current price is within that area
• SD level has been penetrated more than 50%. If distal line cell is Yellow, it will mean that price has penetrated your SD zone at least 50%
• Price is low in the curve . If we are low in the curve 0-40%, the % cell will be highlighted in blue
• Price is in the middle of the curve. If we are 40-60 % in the curve, the % cell will be highlighted in green
• Price is high in the curve. If we are high in the curve 40-60 %, the % cell will be highlighted in green
• Spread is too high. If spread is bigger than the average on your broker (this is a personal setting), then the spread cell will be highlighted in yellow
Why all these conditions?
This is the first thing I do in the mornings or at any time of the day that I start trading, I will know which pairs I should look at first, because if the levels are broken or penetrated, if price is too high or low in the curve or, I will be interested in setting a limit order at the first valid previous SD level with a good imbalance, to keep on trading in the direction of the breakout or the rejection.
How to add more currency pairs or how to modify existing ones if your broker uses suffixes for symbols?
• Many brokers use suffixes like . pro, m, etc, that are added at the end of the symbol. If that is your case, you need to edit the current price cell formula =DDE("MT4";"BID";"EURUSD";1) and change it to whatever your symbol is, like for example: =DDE("MT4";"BID";"EURUSD.pro";1). You have to change that for both current price column and spread column, because the spread column uses both bid and ask prices
• There are some calculations that use columns on the far right on the spreadsheet and some variables lower. If you move the cells or columns, some of these calculations will not work, like the % of penetration of a level, because it uses a fix variable within the conditional formatting, like Sheet1.$AC$9<W49. If you move that variable from cell W49 to another cell, then a few conditional formatting will stop working
• If you see a cell with N\A or #VALUE, it will mean that either there is no connection to MT's DDE server, that that pair is not supported by your broker, that pair name is different in your broker (maybe some suffix/preffix need to be added to root name), or that you haven't changed permissions on Windoews' UAC Module as described on the "How to install" below
WHAT DO YOU NEED IN ORDER TO INSTALL THIS SPREADSHEET?
• Tick the DDE server checkbox to true under your Metatrader Tools/Options's server tab
• Download and install Open Office Calc. Excel was giving me a lot of problems with prices, comma separators and it blocked sometimes
• Set the permissions for UAC (User Account Control) to low, or DDE will not work. Follow this tutorial and set it to the lowest low http://www.howtogeek.com/howto/3340/...-in-windows-7/
- Once you have MT running and ticking (not before), load the spreadsheet on your Open Calc
- When it prompts a popup, say YES to update content
- THAT'S ALL
NEW ADDITIONS
I've many other ideas in mind, but I don't have the programming skills to code them. It would require MQL coding and on how to exchange information between MT4 and Excel/Open Office Calc. There are ways to automatically calculate brand new 1H/4H/D1 levels, or any timeframe's levels. This is great because at any moment in time, the spreadsheet would be able to detect real time all new SD levels and filter them by age, pair and how fresh they area.
If anybody out there has the knowledge to do this, please contact me, it would be an incredible and powerful tool for those who trade supply and demand level, which is what moves the markets after all.
Any feedback is welcome! This is just the start of what I believe could be a bigger project that could make trading for those SD traders easier and funnier.
P.S. Excel version. I've not created this spreadsheet under Excel because it gave me a lot of problems. If anybody has the knowledge and can do it under Excel, it would be great.