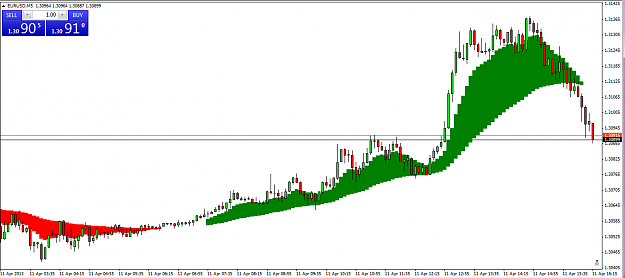
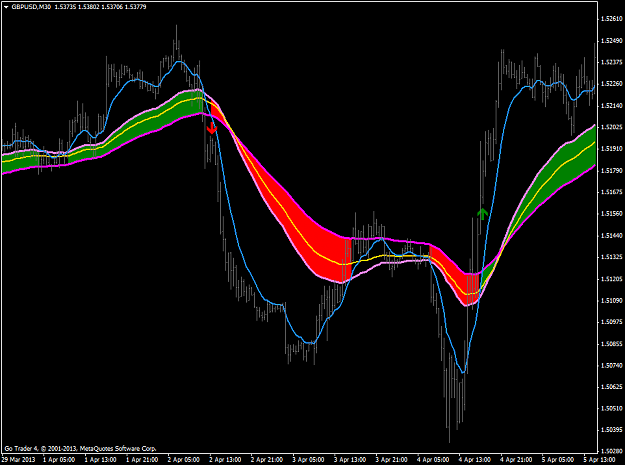
DislikedTry this it is using bits of code suggested on this thread plus some of my code and I think it produces the correct result. MA Filled v1 is the version with the dotted filler colors MA Filled v2 is the version with the solid filler colors Both are the same its just the line and Histo widths and styles have been altered. {file} {file} {image} {image} {image}Ignored
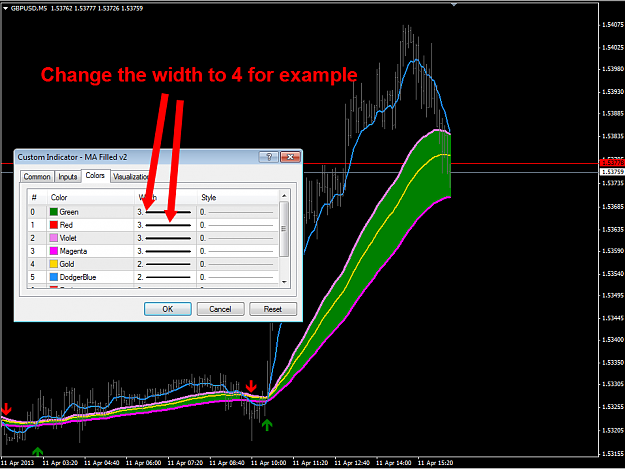
Thanks a million buddy..this is almost the same thing Im looking for. I have plotted the MA2 but im not getting the filled in colors. They are still dashed.
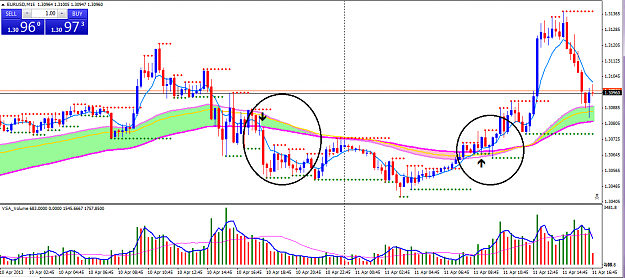
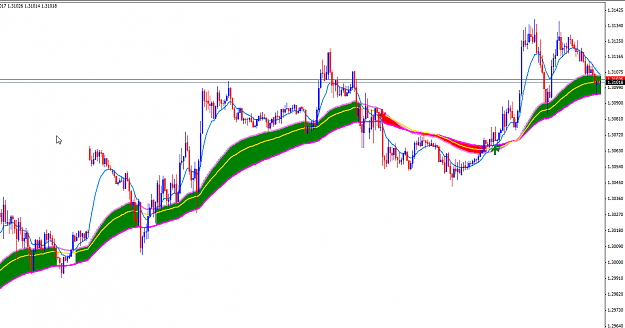
Have a look at the chart I see. In your chart it looks awesome but I cant plot it the same way..may be im missing anything. Pls help.
Attached Image (click to enlarge)