Hey all, I'm pretty new to posting here but I've been lurking and learning for a little while now. I put together this simple multi-RSI template to easily visualize what's happening with the pair as a whole. I don't believe the market has a timeframe.
This RSI "system" is a work in progress. I don't take credit for any of this, as I'm sure it has been done before. I have taken ideas from others and tried to fit them to my style.
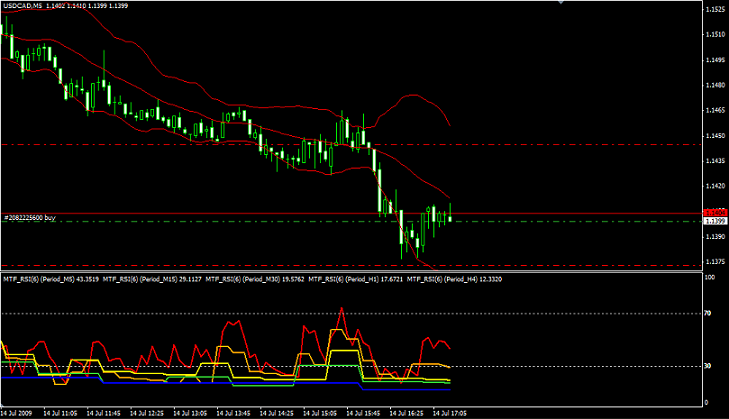
I use this template that has a 5M, 15M, 30M, 1H, and 4H RSIs overlayed on each other in different colors. Thought I should name it something catchy with fire since it kind of resembles a flickering flame, but forget it. Haha.
Red - 5M
Orange - 15M
Yellow - 30M
Green - 1H
Blue - 4H
You may notice I also have Bollinger Bands on the chart, I haven't really incorporated them too much. They just provide more ideas of support and resistance.
I tend to wait to trade around round number ending in 00 or 50. I wait for most or all of the RSIs to be oversold (below 30, putting more emphasis on the shorter timeframes). When 1 or 2 shorter time frames start to rise past 30 again I go long (opposite for short obviously).
Take profit I have quite figured out yet. I'll most likely trail my stop behind the most recent support. Lot size is dependent on risk as stops will vary. I may take profit at major resistance.
Any ideas and modifications are welcome. We're all in this together, let me know what you think!
EDIT: Forgot to mention, the RSIs only show past results on timeframes that are equal or greater. I use the 5M chart and attempt to grab 30-50 pips.
Currently long on USD/CAD.
EDIT: Got stopped out at breakeven. I'm aggresive with my breakevens because I feel capital preservation is number one. I'm willing to take many a breakeven trade and a few winners than instead of more winners and losers that lead to drawdown.
This RSI "system" is a work in progress. I don't take credit for any of this, as I'm sure it has been done before. I have taken ideas from others and tried to fit them to my style.
I use this template that has a 5M, 15M, 30M, 1H, and 4H RSIs overlayed on each other in different colors. Thought I should name it something catchy with fire since it kind of resembles a flickering flame, but forget it. Haha.
Red - 5M
Orange - 15M
Yellow - 30M
Green - 1H
Blue - 4H
You may notice I also have Bollinger Bands on the chart, I haven't really incorporated them too much. They just provide more ideas of support and resistance.
I tend to wait to trade around round number ending in 00 or 50. I wait for most or all of the RSIs to be oversold (below 30, putting more emphasis on the shorter timeframes). When 1 or 2 shorter time frames start to rise past 30 again I go long (opposite for short obviously).
Take profit I have quite figured out yet. I'll most likely trail my stop behind the most recent support. Lot size is dependent on risk as stops will vary. I may take profit at major resistance.
Any ideas and modifications are welcome. We're all in this together, let me know what you think!
EDIT: Forgot to mention, the RSIs only show past results on timeframes that are equal or greater. I use the 5M chart and attempt to grab 30-50 pips.
Currently long on USD/CAD.
EDIT: Got stopped out at breakeven. I'm aggresive with my breakevens because I feel capital preservation is number one. I'm willing to take many a breakeven trade and a few winners than instead of more winners and losers that lead to drawdown.
Attached Image
Attached File(s)