EUR/USD
5 min chart
25sma
10sma
optional: rsi 9.
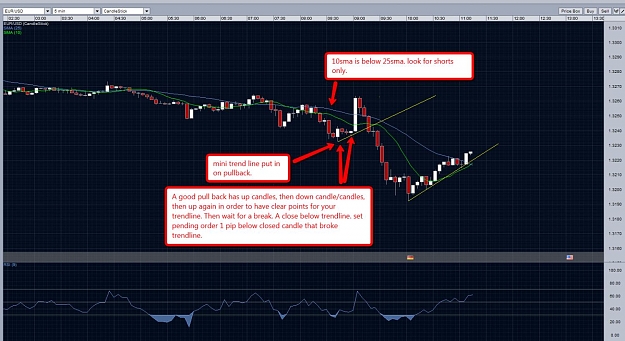
10sma below 25sma. Only look for shorts.
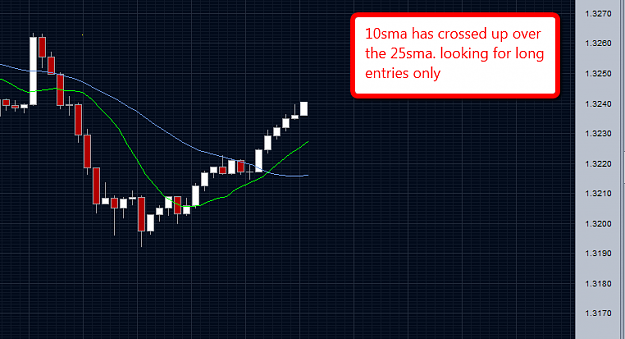
10sma above 25sma. Only look for longs.
Short example:
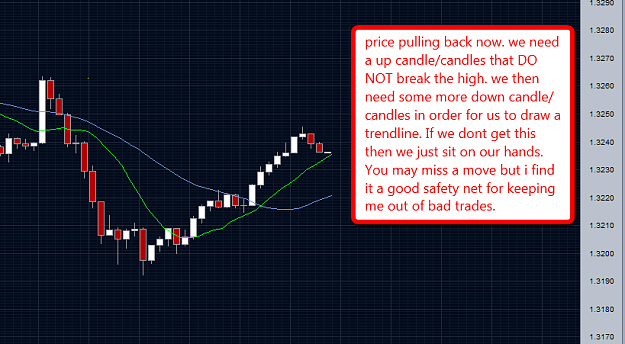
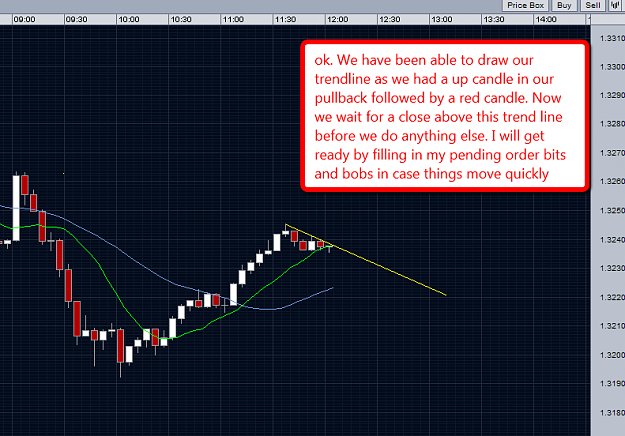
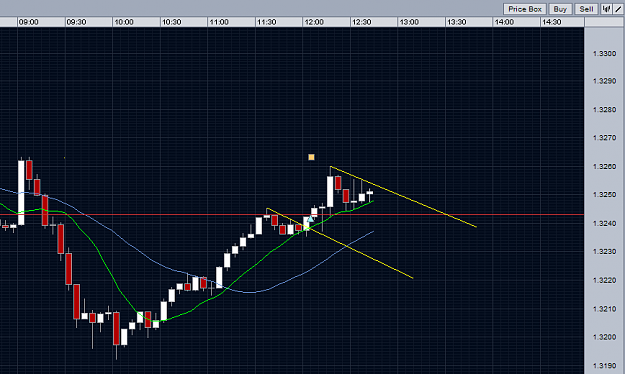
smas have given you a direction. we wait for a pullback. Then wait for a mini trendline break. candle must close beyond the break. Entry would be 1pip from candle that broke trendline.
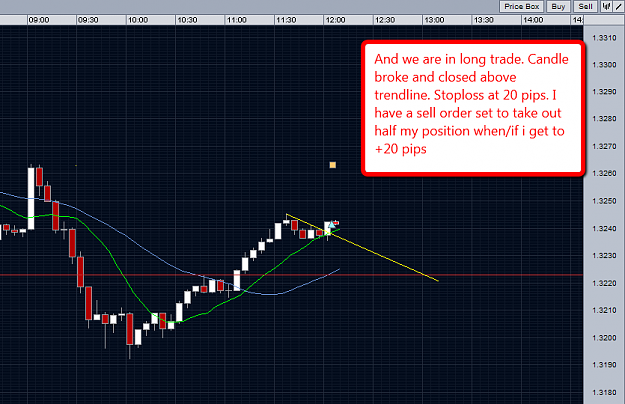
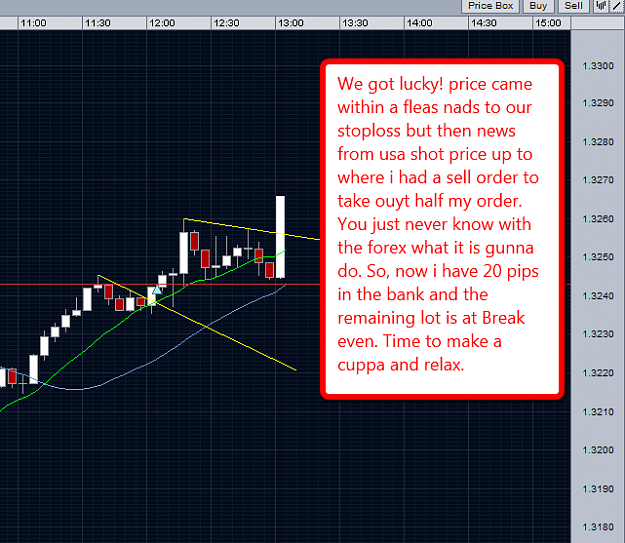
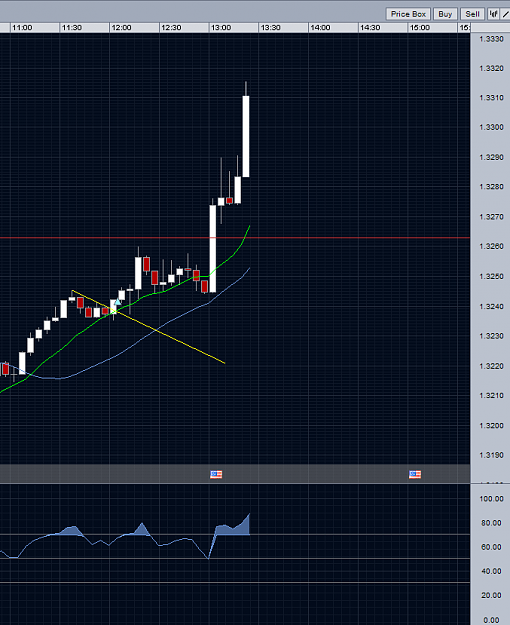
trade mangement is up to you. What i do is enter 2 lots. I use a fixed 20pip stop loss. my first lot i close at +20 pips. Then i move 2nd lot to break even and trail it for as much as i can. RSI 9 is good on the 5min chart for spotting divergence. I use this to help with exits for my 2nd lot. if i see strong divergence I will close my 2nd lot. sometimes i just close 2nd lot if i happy with amount of pips. This is up to you.
Thats it. Simple. This is something that I have been playing with for ages and seems reasonably successfull. This has been done before in many forms. it nothing exciting or new but it works and hopefully it can help someone who may be struggling to get going with forex. I work strange days and hours so cant be be around all the time so feel free to post what you like and take this wherever you want to. Please be helpfull rather than negative. I have tried out almost all of the systems on forex factory and still enjoy trying out the new ones that pop up. However, this is how i currently trade. There was a very good thread here called flag trading the trend which is pretty much where i have taken this from so credit to that thread.
Goog luck.
5 min chart
25sma
10sma
optional: rsi 9.
10sma below 25sma. Only look for shorts.
10sma above 25sma. Only look for longs.
Short example:
smas have given you a direction. we wait for a pullback. Then wait for a mini trendline break. candle must close beyond the break. Entry would be 1pip from candle that broke trendline.
trade mangement is up to you. What i do is enter 2 lots. I use a fixed 20pip stop loss. my first lot i close at +20 pips. Then i move 2nd lot to break even and trail it for as much as i can. RSI 9 is good on the 5min chart for spotting divergence. I use this to help with exits for my 2nd lot. if i see strong divergence I will close my 2nd lot. sometimes i just close 2nd lot if i happy with amount of pips. This is up to you.
Thats it. Simple. This is something that I have been playing with for ages and seems reasonably successfull. This has been done before in many forms. it nothing exciting or new but it works and hopefully it can help someone who may be struggling to get going with forex. I work strange days and hours so cant be be around all the time so feel free to post what you like and take this wherever you want to. Please be helpfull rather than negative. I have tried out almost all of the systems on forex factory and still enjoy trying out the new ones that pop up. However, this is how i currently trade. There was a very good thread here called flag trading the trend which is pretty much where i have taken this from so credit to that thread.
Goog luck.
Attached Image (click to enlarge)