(Note: I am not a profitable trader. If you decide to follow my trade style do so on demo)
(More than just the trading system below is being used!)
Here I will track my trading successes and failures. The system is a fairly simple no indicator approach. Details below
On a daily chart plot a horizontal line (blue on my charts) at each significant HH/LL & HL/LH. This will serve as places to watch for major reversal or retrace.
Next we have a 20 pip by 8 hour grid. This plots a grid on the chart with vertical lines every 8 hours and horizontal lines every 25 pips. Blue vertical lines for each new day and golden lines for pip increments. This helps with determining how far price has already moved throughout the day without taking the time to measure. It will also helps with profit targets.
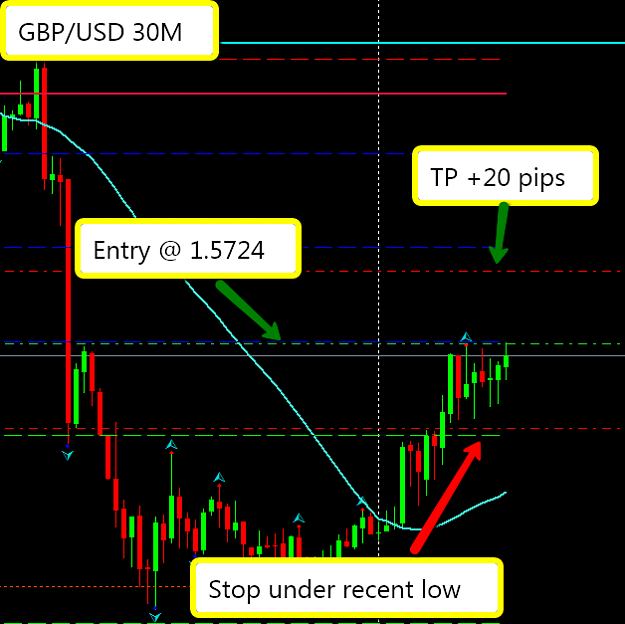
For entries I will be using a method called "count back" or V reversal formation. Lets say we are in a down trend and price retraces and is expected to continue with the down trend. For every extreme high count back two bars and place a sell stop order at the low of the second bar. Keep moving the sell stop order till price reverse. Same for a uptrend.
Count back has been reduced to one bar.
Time frame - 15M
Profit targets - from 15-30 pips, Daily pivot points (blue lines), and short term support/resistance.
Stop - placed under/above the high or low or max 2%.
Trading hours - 6am to 2pm EST.
Goals:
15 pips per day
75 pips per week
300 pips per month
After this year (2012) if I have successfully traded this approach with the above targets I should have the confidence and knowhow to start trading $2,500. Also have added trade explorer to the thread.
(More than just the trading system below is being used!)
Here I will track my trading successes and failures. The system is a fairly simple no indicator approach. Details below
On a daily chart plot a horizontal line (blue on my charts) at each significant HH/LL & HL/LH. This will serve as places to watch for major reversal or retrace.
Next we have a 20 pip by 8 hour grid. This plots a grid on the chart with vertical lines every 8 hours and horizontal lines every 25 pips. Blue vertical lines for each new day and golden lines for pip increments. This helps with determining how far price has already moved throughout the day without taking the time to measure. It will also helps with profit targets.
For entries I will be using a method called "count back" or V reversal formation. Lets say we are in a down trend and price retraces and is expected to continue with the down trend. For every extreme high count back two bars and place a sell stop order at the low of the second bar. Keep moving the sell stop order till price reverse. Same for a uptrend.
Count back has been reduced to one bar.
Time frame - 15M
Profit targets - from 15-30 pips, Daily pivot points (blue lines), and short term support/resistance.
Stop - placed under/above the high or low or max 2%.
Trading hours - 6am to 2pm EST.
Goals:
15 pips per day
75 pips per week
300 pips per month
After this year (2012) if I have successfully traded this approach with the above targets I should have the confidence and knowhow to start trading $2,500. Also have added trade explorer to the thread.