Hello everyone.
I would like to share a system with you to get your feedback and maybe spread the green pips around .
.
I am not going to give you my life story and how all this came about. I am however interested in sharing this sytem, and letting people test drive this system and giving it an honest "kick at the can" especially in the Frankfort/London trading session, during which i am getting my sleep. I also work full time (not as a trader, unfortunately) 9 am to 6 pm in NY session. As a result, my screen time is limited and I do not catch many setups. For future reference you will notice that the time on my chart is EST (Eastern Standard Time) and any times/hours that i mention will be all EST as that is my time zone (otherwise known as NY time zone).
Rules of the thread are very simple; we are all adults here, and it is expected of us all to behave as such. Ask as many questions as you feel necessary, and please post your feedback, discussion, and comments, along with CLEARLY MARKED CHARTS so that we can all learn from each other. This would be great opportunity for those experienced traders to give some assistance to the not-so-experienced traders out there. I will try my best to answer any questions, but if you feel that you can help out by answering, you are more than welcome to do so. As mentioned above, I work fulltime and I do have a family and need some sleep, so please be patient as my responses to your questions may not be as quick as desired.
OK, now that I got all that out of my system, now on to the trading system itself ...
The required tools:
1- MT4 platform with 5-min or 15-min charts
2- Indicators: some will be used for setup, some for trade trigger, and some for confirmation.
3- Familiarity with price action, candle sticks, pivot points, support/resistance, trendlines and channels are always helpful.
Trade Setup indicators:
EMA(50) and EMA(100) both applied to the candle close.
This is what determines the "trend". If EMA(50) is above EMA(100) we will only be looking for a Buy trigger. If EMA(50) is below EMA(100) we will be looking for a Sell trigger.
Trade Trigger Indicators:
BBands Stop (8,2,0.2,1,1,1000, true) applied on the chart with blue and red colours. If BBStop is blue it means long if BBStop is red it means shortl. However, what we will take as a Sell trigger is that BBStop has turned red, and is BELOW both the EMA(50) and EMA(100). ALSO the price has crossed below the candle where theBBStop "large red dot" appears. This large red dot is the start of the down trend according to BBStop. This large BBStop dot will produce an alert on your platform so it is a nice way to let you know we might be getting a trend setup soon. Reverse the above for a Buy.
Trade confirmation Indicators:
These are TrendLord and 4TF-HAS are used to confirm your trade. Once the setup and trigger indicators are all lined up for you to take trade, take a final look at the confirmation indicators to make sure they agree with your decision. The 4TF-HAS and Trendlord have to be red for a sell, and green for a buy. A word of caution about these indicators when your charts get stale (not updated in a while your screen saver kicks in or whatever), you may need to refresh your charts by switching to a diffrent time frame and back to the desired time frame on the chart to refresh the indicator.
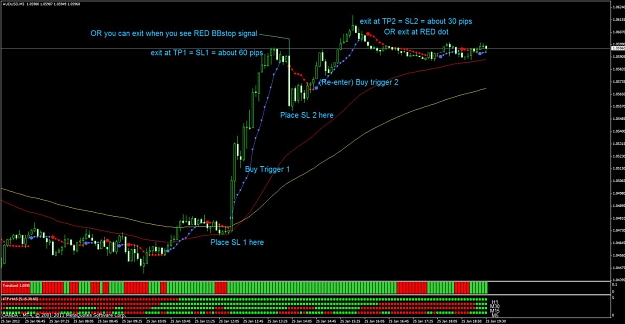
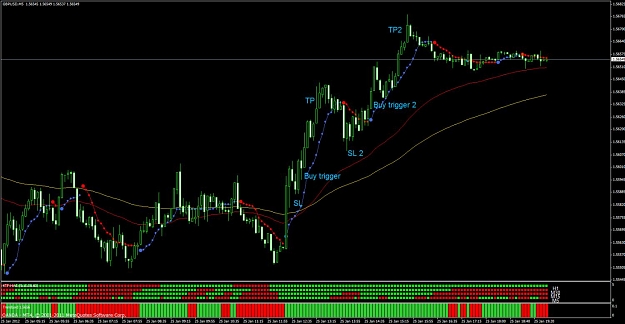
That is the basic system in a nutshell. There will be many details to iron out I am sure such as TP target, SL placement, re-entering a trade, etc. I generally like to use the last swing high/low (or the big dot) as my SL, and then set my TP target as 1:1 on 1/2 my position and 1:2 on second 1/2 of my position and using a jumping stop on this second 1/2 position. I am sure there are many ways to manage a trade and this can be discussed in the thread among followers as each trader's comfort and risk level is different than others. I will be giving general guidelines, but then again nothing is etched in stone here.
Extra Indicator:
AFST Exact entries is a pivot point calculator that places the daily pivot points on your chart. If you would like to use those as possible turning points or TP/SL targets, you can use this indicator (with default settings) at your discretion.
Trading Sessions:
I like to see this system traded between Frankfort open to London close. Avoid dead hours like 2pm EST to 7pm EST. Asian session tends to be very rangy and slow moving, but sometimes you get some nice explosive moves if you are willing to watch for those.
News Events:
I generally try to avoid trading around news releases. Or if i am in a trade already I either close out the trade or tighten the stops before the news releases.
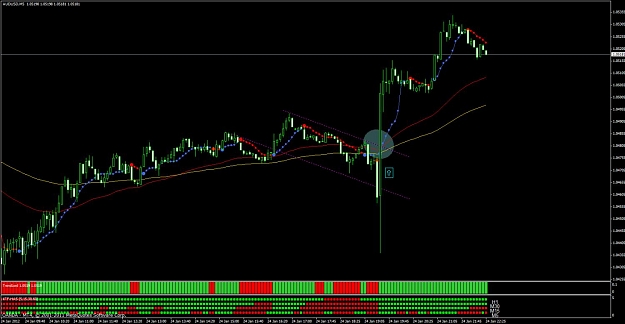
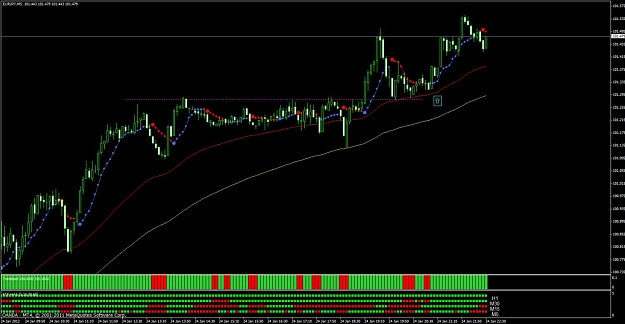
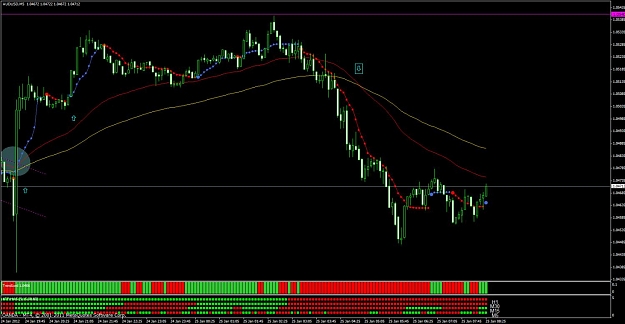
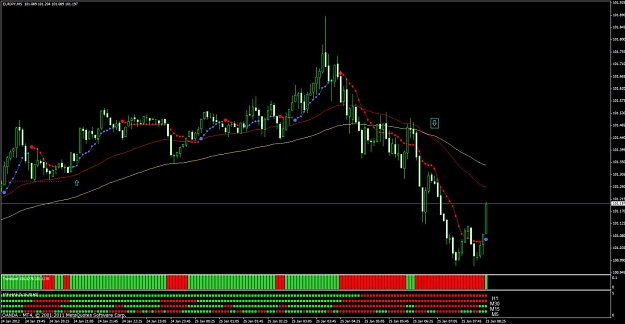
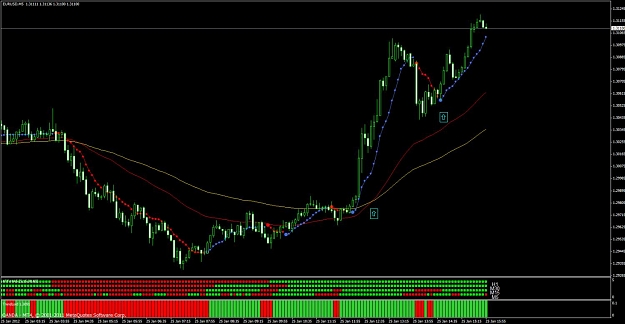
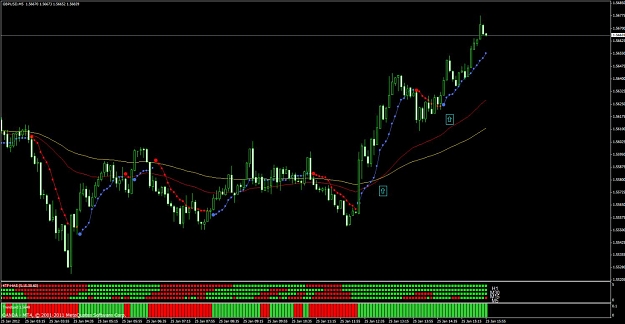
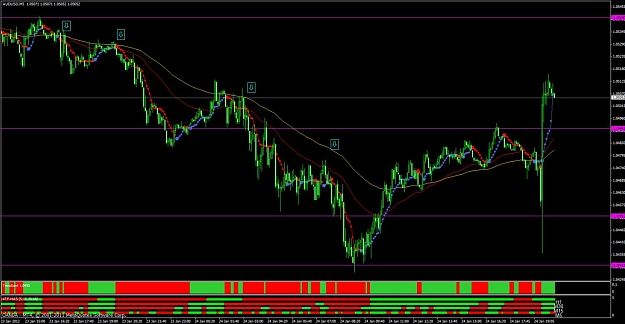
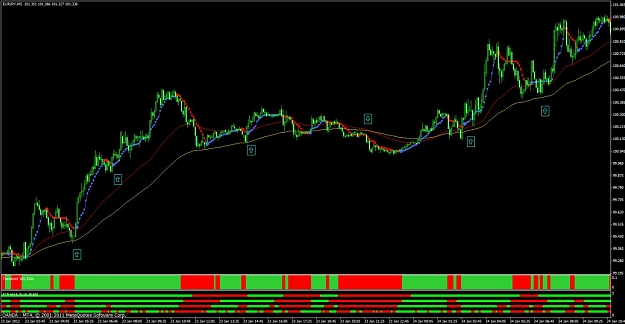
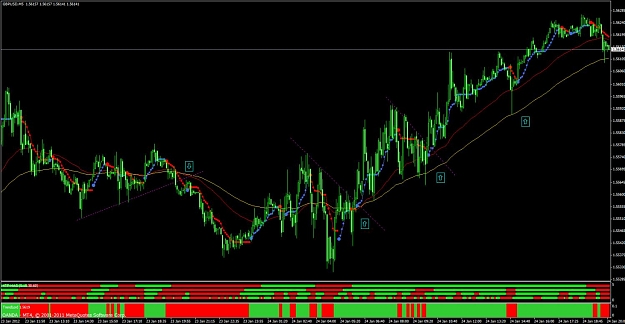
Examples:
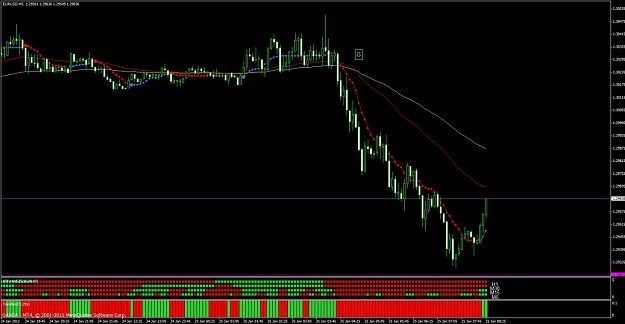
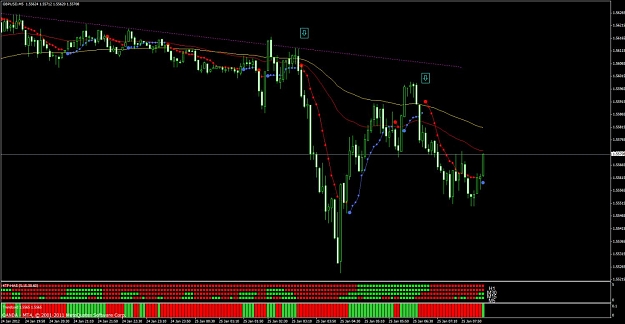
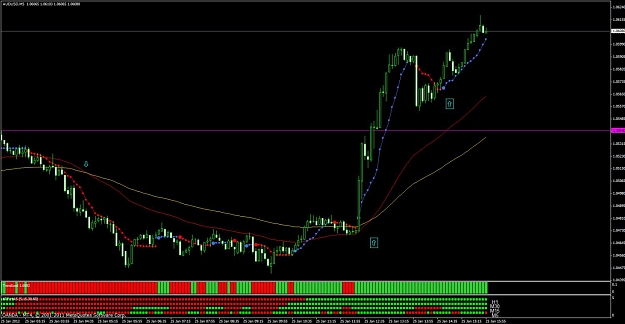
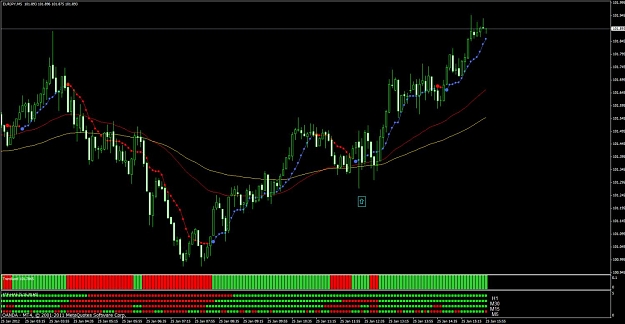
The best way to describe this system is to show chart examples. Here are a few examples from very recent charts below
Indicators and template
are attached below. Please do not ask me how to use those as i have given you the template already
I would like to thank you for your attention and investing the time to read what I had to write. Please feel free to post questions, suggestions, and be kind enough to post charts showing setups and actual trades taken (on demo account only for now of course)
if you take any trades. When posting charts, please indicate the time frame and the currency pair that you are talking about so we can all follow along.
Please dont misunderstand me here as I am not being arrogant or rude. I would kindly and respectfully ask that you do not ask me how long I have traded this and how profitable it is and whether or not you will be successful with it. Each trader is different and each trader can make or break a system. YOU need to test this for yourself and only you can decide if this system is something that you think you can trade successfully ... best of luck to all.
I would like to share a system with you to get your feedback and maybe spread the green pips around
I am not going to give you my life story and how all this came about. I am however interested in sharing this sytem, and letting people test drive this system and giving it an honest "kick at the can" especially in the Frankfort/London trading session, during which i am getting my sleep. I also work full time (not as a trader, unfortunately) 9 am to 6 pm in NY session. As a result, my screen time is limited and I do not catch many setups. For future reference you will notice that the time on my chart is EST (Eastern Standard Time) and any times/hours that i mention will be all EST as that is my time zone (otherwise known as NY time zone).
Rules of the thread are very simple; we are all adults here, and it is expected of us all to behave as such. Ask as many questions as you feel necessary, and please post your feedback, discussion, and comments, along with CLEARLY MARKED CHARTS so that we can all learn from each other. This would be great opportunity for those experienced traders to give some assistance to the not-so-experienced traders out there. I will try my best to answer any questions, but if you feel that you can help out by answering, you are more than welcome to do so. As mentioned above, I work fulltime and I do have a family and need some sleep, so please be patient as my responses to your questions may not be as quick as desired.
OK, now that I got all that out of my system, now on to the trading system itself ...
The required tools:
1- MT4 platform with 5-min or 15-min charts
2- Indicators: some will be used for setup, some for trade trigger, and some for confirmation.
3- Familiarity with price action, candle sticks, pivot points, support/resistance, trendlines and channels are always helpful.
Trade Setup indicators:
EMA(50) and EMA(100) both applied to the candle close.
This is what determines the "trend". If EMA(50) is above EMA(100) we will only be looking for a Buy trigger. If EMA(50) is below EMA(100) we will be looking for a Sell trigger.
Trade Trigger Indicators:
BBands Stop (8,2,0.2,1,1,1000, true) applied on the chart with blue and red colours. If BBStop is blue it means long if BBStop is red it means shortl. However, what we will take as a Sell trigger is that BBStop has turned red, and is BELOW both the EMA(50) and EMA(100). ALSO the price has crossed below the candle where theBBStop "large red dot" appears. This large red dot is the start of the down trend according to BBStop. This large BBStop dot will produce an alert on your platform so it is a nice way to let you know we might be getting a trend setup soon. Reverse the above for a Buy.
Trade confirmation Indicators:
These are TrendLord and 4TF-HAS are used to confirm your trade. Once the setup and trigger indicators are all lined up for you to take trade, take a final look at the confirmation indicators to make sure they agree with your decision. The 4TF-HAS and Trendlord have to be red for a sell, and green for a buy. A word of caution about these indicators when your charts get stale (not updated in a while your screen saver kicks in or whatever), you may need to refresh your charts by switching to a diffrent time frame and back to the desired time frame on the chart to refresh the indicator.
That is the basic system in a nutshell. There will be many details to iron out I am sure such as TP target, SL placement, re-entering a trade, etc. I generally like to use the last swing high/low (or the big dot) as my SL, and then set my TP target as 1:1 on 1/2 my position and 1:2 on second 1/2 of my position and using a jumping stop on this second 1/2 position. I am sure there are many ways to manage a trade and this can be discussed in the thread among followers as each trader's comfort and risk level is different than others. I will be giving general guidelines, but then again nothing is etched in stone here.
Extra Indicator:
AFST Exact entries is a pivot point calculator that places the daily pivot points on your chart. If you would like to use those as possible turning points or TP/SL targets, you can use this indicator (with default settings) at your discretion.
Trading Sessions:
I like to see this system traded between Frankfort open to London close. Avoid dead hours like 2pm EST to 7pm EST. Asian session tends to be very rangy and slow moving, but sometimes you get some nice explosive moves if you are willing to watch for those.
News Events:
I generally try to avoid trading around news releases. Or if i am in a trade already I either close out the trade or tighten the stops before the news releases.
Examples:
The best way to describe this system is to show chart examples. Here are a few examples from very recent charts below
Indicators and template
are attached below. Please do not ask me how to use those as i have given you the template already
I would like to thank you for your attention and investing the time to read what I had to write. Please feel free to post questions, suggestions, and be kind enough to post charts showing setups and actual trades taken (on demo account only for now of course)
if you take any trades. When posting charts, please indicate the time frame and the currency pair that you are talking about so we can all follow along.
Please dont misunderstand me here as I am not being arrogant or rude. I would kindly and respectfully ask that you do not ask me how long I have traded this and how profitable it is and whether or not you will be successful with it. Each trader is different and each trader can make or break a system. YOU need to test this for yourself and only you can decide if this system is something that you think you can trade successfully ... best of luck to all.
Attached Image(s) (click to enlarge)
Attached File(s)