Hi Guys,
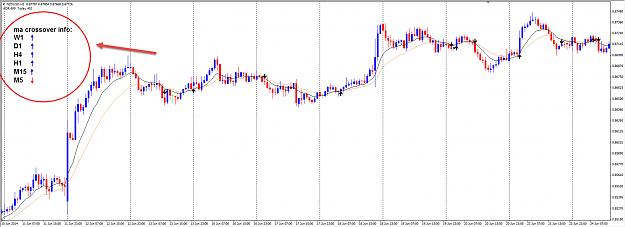
If its out there I can't find it. On my 15 min metatrader chart I'm trying to find a MA crossover indicator for the higher Timeframe that displays in the separate window a block/bar which is coloured to match the higher timeframe MA positions.
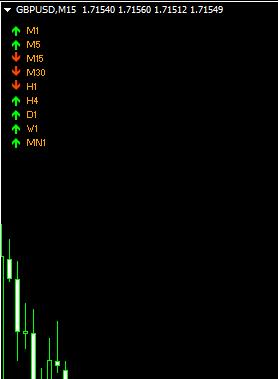
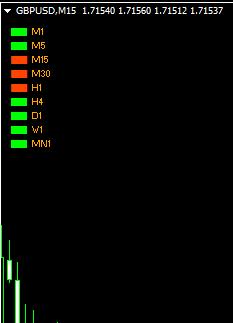
So on my 15 min chart I want to see in a separate window:
a green block/bar if 21 MA is above 34 MA on the 4hr
a orange bar if they are crossing
and a red bar if, on higher 4hr TF the MA is below.
I can plot 2 x MTF Mas on my chart and look at them but its not really what I want, it gets a bit messy. Can same info be used to plot coloured blocks in the separate window, green, red or orange showing higher TF MA above/below/crossing?.
Thanks
PG
If its out there I can't find it. On my 15 min metatrader chart I'm trying to find a MA crossover indicator for the higher Timeframe that displays in the separate window a block/bar which is coloured to match the higher timeframe MA positions.
So on my 15 min chart I want to see in a separate window:
a green block/bar if 21 MA is above 34 MA on the 4hr
a orange bar if they are crossing
and a red bar if, on higher 4hr TF the MA is below.
I can plot 2 x MTF Mas on my chart and look at them but its not really what I want, it gets a bit messy. Can same info be used to plot coloured blocks in the separate window, green, red or orange showing higher TF MA above/below/crossing?.
Thanks
PG