Hello Everybody !!!
I want to share this system, I been using it for a while, and after I moved to another systems, but after all I back to good old system.
This system has different names like Power Band, E-75, but the idia of this system coming from Steve Nison. In his books and dvds you can find that Candlestick patterns appears on support and resistance levels, confirming S/R. He offers to use candles with western technology, such as Bollinger Bands and oscillators, in our case it is Stochastic.
I am using M15 time frame for trading, you can use higher time frame, but I wouldn’t go lower.
For set up I am using:
- Bollinger Band standard (period 20, shift 0, deviations 2, apply to close)
- Stochastic (9,3,3)
- Resistance and Support levels
- Candlestick patterns
- EMA 100, 200, 365 (Moving average Exponential apply to close)
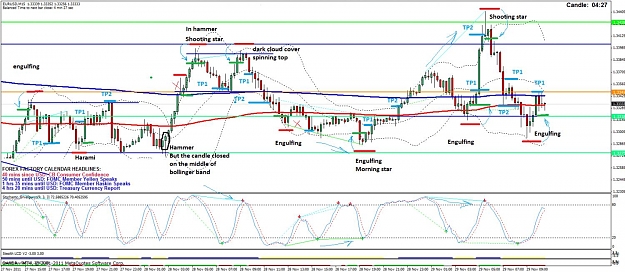
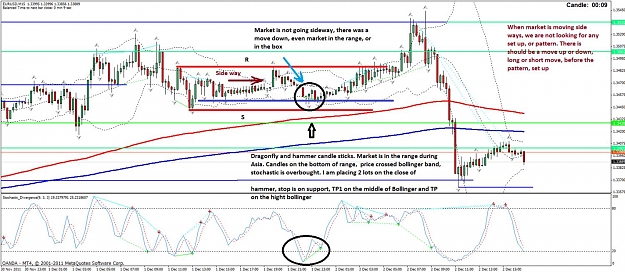
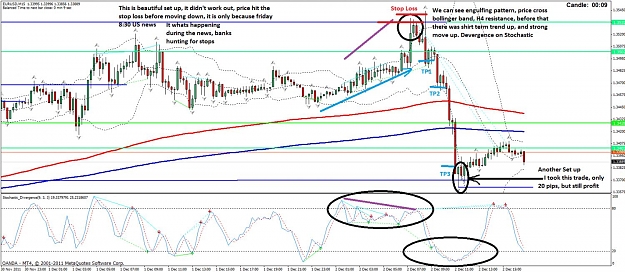
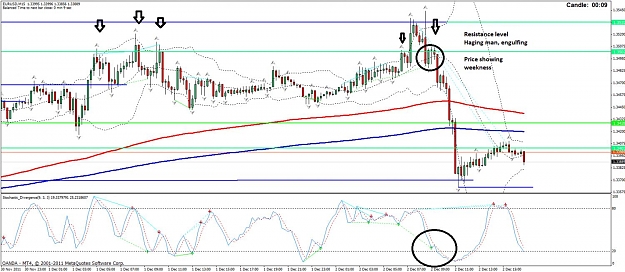
The main idea is that we need confirmation for candlestick pattern. This confirmation is Bands, stoch and S/R. We are looking for patterns such as engulfing, piercing, dark cloud cover, stars, hummer and also doji. Doji is not a reversal candle, doji means that market is neutral.
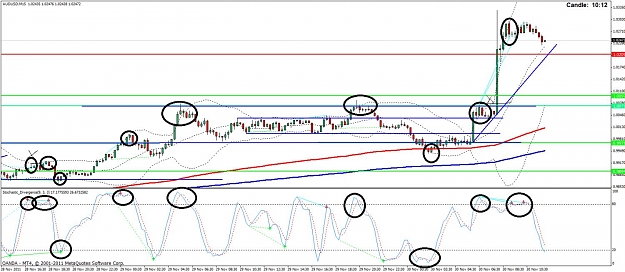
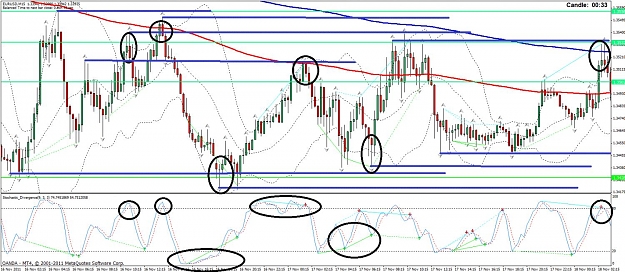
What we are looking for is that candlestick pattern have to be on higher or lower bollinger band, price should cross or touch band, there have to be S/R level, EMA could be support or resistance, and stochastic is overbought, oversold, or in some cases there is divergence, normal not hidden.
Currencies which I am using is 3 amigos EUR/USD, GBP/USD, AUD/USD, this currencies moving pretty much in the same direction, especially when there is a strong move on the dollar.We are choosing only one pair which gives us better set up. During Asia i prefer AUD, during Europe GBP, during Usa Euro. But again we are looking for best set up.
Placing order after candle is closed. We are plasing 2 or 3 lots.
Stop Loss have to be above the candle or pattern, I don’t have exact amount on stop loss, I am placing stop loss 15-25 pips from initial position above candle or above resistance, opposite for buy. Power band system oferring 10% above canle, E-75 3-5 pips above.
Target is middle of bollinger band and lower level of bollinger band, this for sell, buy is opposite. As we have 2 or 3 lots. One lot should be closed on the Middle of bollinger band, and stop loss should be moved to brake even. In some cases there is support level before Middle level, I will close one lot and move stop loss to break even, in case market will be stopped on that support. Second lot should be closed on lower bollinger band, if market is in trend I will leave third lot open to take more profit.
This system works good in ranging market, in trending market you have to wait for retracement.
When you see strong move on the market don’t try to catch bottom or top, wait until market stops.
About trading hours, I am starting at 6pm EST, and usually i am out by 10 am EST, if there is important news on USA, i will close all positions by 7 am EST.
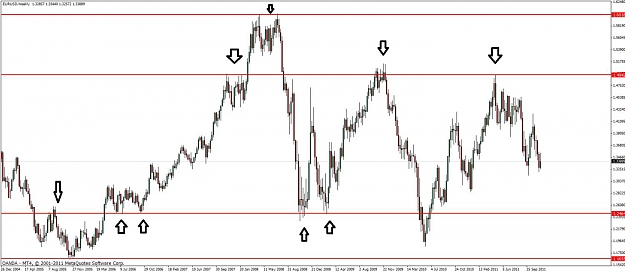
Support and resistance levels, i am going from Weekly to H4 charts to find S/R and placing on the chart. Lower time frame as M15 and H1 R/S i am placing on my charts, but when it is broken i am removing it from the chart
Risk reward is very important. When you are opening the trade, you should look for the targets, first is middle bollinger band, and second high or low of bollinger band. Your risk reward when you are opening trade should be not less then 1:1 to the middle of bollinger band, and not less then 2:1 on the high or low bollinger band.
I will give some examples and place charts every day. I am full time trader, and I watching market all the time, so probably I will place charts on the end of my trading day.
You can apply to this system other methods which you are comfortable with, such as fibo levels, harmonic patterns and other
I will upload stochastic, which is showing divergence with alert, hidden and normal, we will be looking only on the normal.
I want to share this system, I been using it for a while, and after I moved to another systems, but after all I back to good old system.
This system has different names like Power Band, E-75, but the idia of this system coming from Steve Nison. In his books and dvds you can find that Candlestick patterns appears on support and resistance levels, confirming S/R. He offers to use candles with western technology, such as Bollinger Bands and oscillators, in our case it is Stochastic.
I am using M15 time frame for trading, you can use higher time frame, but I wouldn’t go lower.
For set up I am using:
- Bollinger Band standard (period 20, shift 0, deviations 2, apply to close)
- Stochastic (9,3,3)
- Resistance and Support levels
- Candlestick patterns
- EMA 100, 200, 365 (Moving average Exponential apply to close)
The main idea is that we need confirmation for candlestick pattern. This confirmation is Bands, stoch and S/R. We are looking for patterns such as engulfing, piercing, dark cloud cover, stars, hummer and also doji. Doji is not a reversal candle, doji means that market is neutral.
What we are looking for is that candlestick pattern have to be on higher or lower bollinger band, price should cross or touch band, there have to be S/R level, EMA could be support or resistance, and stochastic is overbought, oversold, or in some cases there is divergence, normal not hidden.
Currencies which I am using is 3 amigos EUR/USD, GBP/USD, AUD/USD, this currencies moving pretty much in the same direction, especially when there is a strong move on the dollar.We are choosing only one pair which gives us better set up. During Asia i prefer AUD, during Europe GBP, during Usa Euro. But again we are looking for best set up.
Placing order after candle is closed. We are plasing 2 or 3 lots.
Stop Loss have to be above the candle or pattern, I don’t have exact amount on stop loss, I am placing stop loss 15-25 pips from initial position above candle or above resistance, opposite for buy. Power band system oferring 10% above canle, E-75 3-5 pips above.
Target is middle of bollinger band and lower level of bollinger band, this for sell, buy is opposite. As we have 2 or 3 lots. One lot should be closed on the Middle of bollinger band, and stop loss should be moved to brake even. In some cases there is support level before Middle level, I will close one lot and move stop loss to break even, in case market will be stopped on that support. Second lot should be closed on lower bollinger band, if market is in trend I will leave third lot open to take more profit.
This system works good in ranging market, in trending market you have to wait for retracement.
When you see strong move on the market don’t try to catch bottom or top, wait until market stops.
About trading hours, I am starting at 6pm EST, and usually i am out by 10 am EST, if there is important news on USA, i will close all positions by 7 am EST.
Support and resistance levels, i am going from Weekly to H4 charts to find S/R and placing on the chart. Lower time frame as M15 and H1 R/S i am placing on my charts, but when it is broken i am removing it from the chart
Risk reward is very important. When you are opening the trade, you should look for the targets, first is middle bollinger band, and second high or low of bollinger band. Your risk reward when you are opening trade should be not less then 1:1 to the middle of bollinger band, and not less then 2:1 on the high or low bollinger band.
I will give some examples and place charts every day. I am full time trader, and I watching market all the time, so probably I will place charts on the end of my trading day.
You can apply to this system other methods which you are comfortable with, such as fibo levels, harmonic patterns and other
I will upload stochastic, which is showing divergence with alert, hidden and normal, we will be looking only on the normal.
Attached Image (click to enlarge)
Attached File(s)