Hello
I've got idea to show candles based on MA.The candles gonna have only 3 points
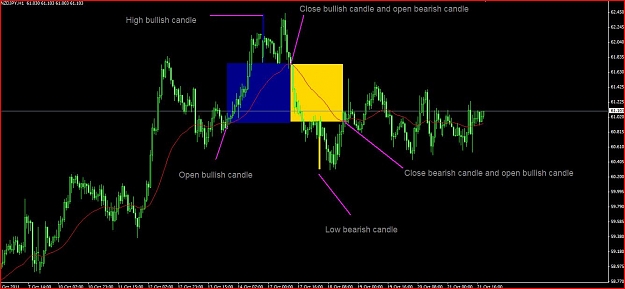
Bullish candle (open,high,close)
Bearish candle (open,low,close)
So price goes from below Ma above MA then we have open of bullish candle andthe price goes higher, after a while the price goes under the MA and we have got close of the bullish candle ,the highest point betwean open and close is the high of the candle, and the similar to a bearish candle...
Like on the picture below
I,m not a coder so if someone think that it is interesting and would code an indicator for this the you are welcome
I've got idea to show candles based on MA.The candles gonna have only 3 points
Bullish candle (open,high,close)
Bearish candle (open,low,close)
So price goes from below Ma above MA then we have open of bullish candle andthe price goes higher, after a while the price goes under the MA and we have got close of the bullish candle ,the highest point betwean open and close is the high of the candle, and the similar to a bearish candle...
Like on the picture below
I,m not a coder so if someone think that it is interesting and would code an indicator for this the you are welcome
Attached Image (click to enlarge)