Hi there,
I'm writing this journal for two purposes. The first is to give back to the site after I've spent so long learning (as well as being distracted by if I'm honest) from it.
The second is less charitable-it's to make sure I document all my trades, both the good and the bad, so the embarassment/annoyance at taking an unplanned trade and having to share it will hopefully help my mental strength.
If no-one reads it then it's still all good as I'll still have to air my dirty linen, if only to myself.
It is no black box system so anyone who wants that then stop reading!
It is a rehash of pretty much most common sense stuff you might have read, but with my own comments that will hopefully make sense/give some guidance.
Note, just sticking with one currency pair is more than enough work, and will provide you with more than enough income. Don't try to analyse the £, $, yen etcetc, you just lose focus. Start with Eur/USD, it has low spreads and is volatile so it's all good.
What you need to do:
Learn about Support and Resistance levels.
http://www.nobrainertrades.com/2008/...ak-levels.html
Learn basic chart patterns (flag, bottom of the bucket etc
http://www.nobrainertrades.com/2008/...of-bucket.html
Learn the 4 types of stoch divergence shown here (the Type 1 and Type 2 diagrams are the most helpful)
http://www.elitetrader.com/tr/index....8&action=print
Learn how to draw trendlines.
Learn Fibonacci retracements. This is actually common sense with a fancy name. Reversals for a trend to continue tend to occur at the 50-62% retracement levels. I don't really draw them anymore.
The system:
I use Alpari UK Metatrader for charting
Chart setup: 8/2/2 stochastics on each timeframe EXCEPT FOR 1 MINUTE CHART-NO INDICATORS ON THIS TIMEFRAME.
Price field set to low/high, MA method-Linear Weighted
Price set to OHLC bars (you can use candlesticks if you prefer it).
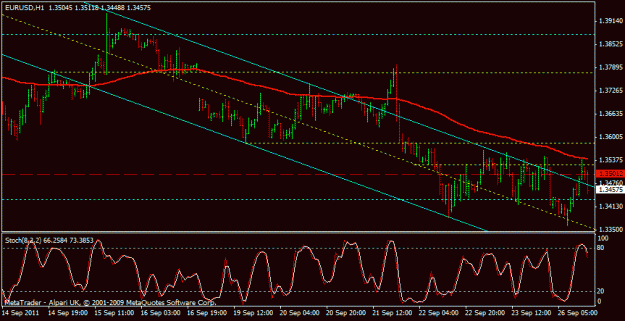
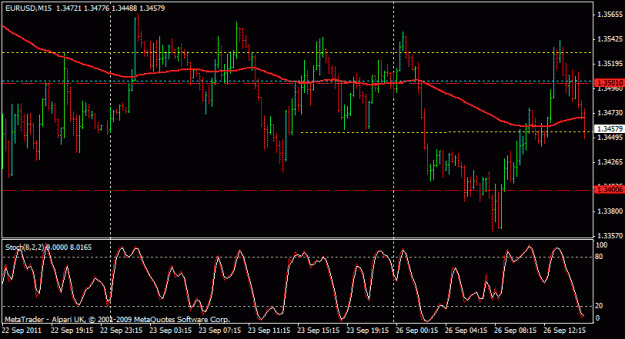
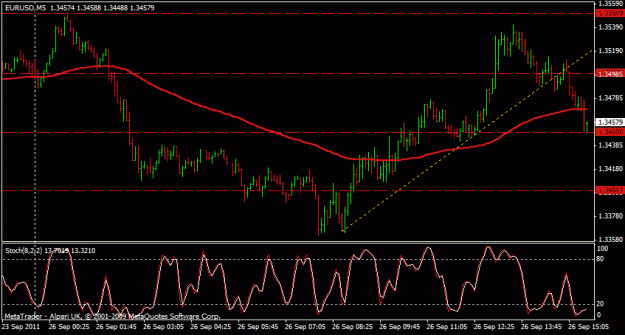
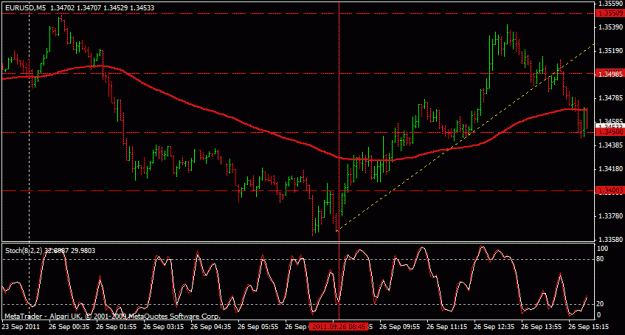
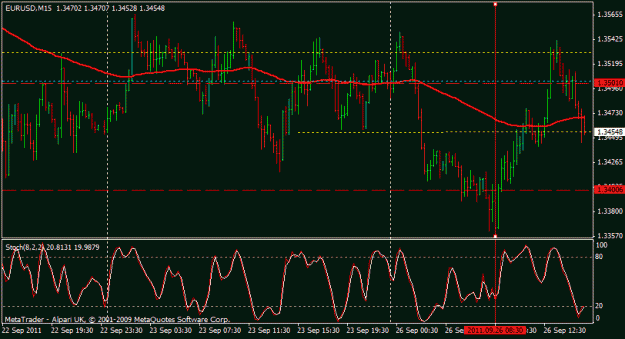
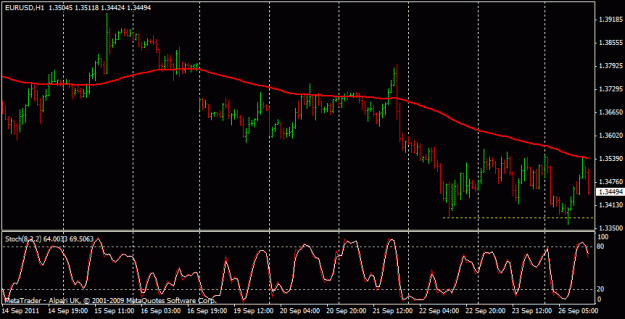
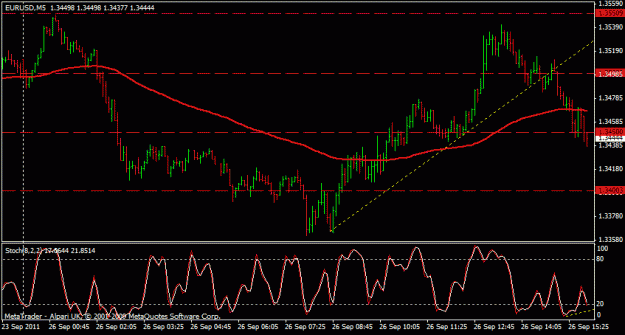
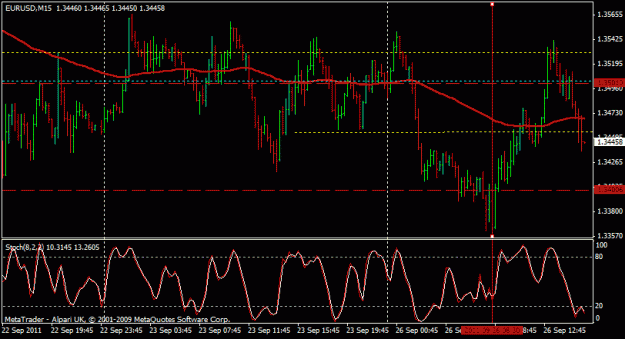
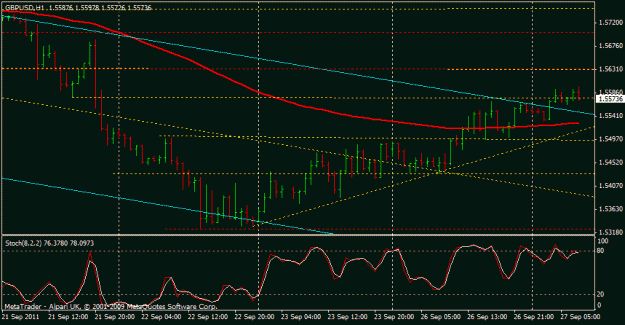
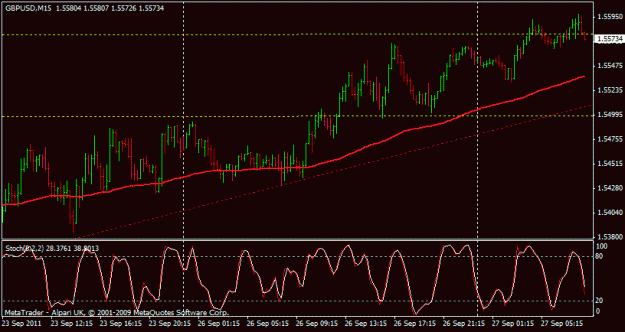
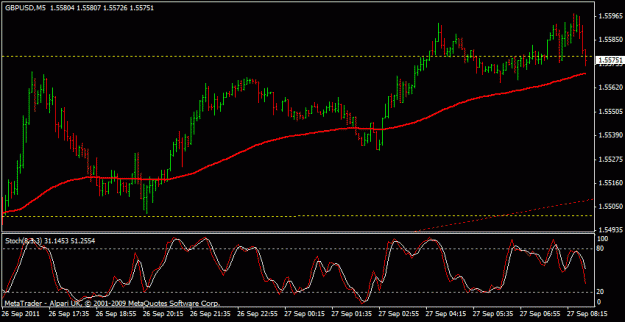
3 timeframes per pair: 1 hour, 15 mins, 5 mins
So now, it's all set up.
To start with, look at the 1 hour chart, and also have a brief flip onto the 4 hour/1 day chart.
Draw lines of major Support and Resistance horizontally across the chart.
TOP TIP
Use a different colour line for the 4 hour/Daily S/R levels, these will be strong areas of interest, and as such should be given a different weighting+a quick way of identifying them to separate them from the 1 hour/15 min levels.
TOP TIP
The 1 hour chart is excellent-it's a long enough time frame to show where you are in the overall bigger trend, but is also an excellent tool for intraday trading. If you're getting a bit carried away looking at 5 min charts (try to avoid looking at them too much!) and all the changes of direction, look at the 1 hour chart- you'll calm down immediately.
TOP TIP
If you're not going to draw them in because there are so many lines (especially on the hourly chart) then be aware of the 50 and 00 price levels. Traders tend to want to hit them, it's kind of a sport, and prices can reverse in these areas, especially the 00 level.
Then draw the same levels of S/R on the 15 min chart.
Then draw the same levels of S/R on the 5 min chart.
This sounds like a lot of work, but it becomes second nature, and you'll breeze through it very quickly with practise.
Analysing the charts/the set up
So after all that, what are we doing, what's the point of all this?
It's simple, price tends to react at S/R levels. If price approaches resistance, it tends to retreat/go lower.
If price approaches support, it tends to bounce up.
But of course, this is not guaranteed to occur.
So what tools do we have that can predict more accurately when these reactions will occur at these S/R levels?
This is where stochastic divergence comes in. Used correctly, it is a VERY powerful tool.
So, armed with your S/R levels derived from your hourly chart, you watch and you wait.
We're looking for prices to approach these S/R levels, and when they do, we switch into stochastic divergence hunting mode.
So, if price is reaching a support level (a significant previous price low), and we look at the 15 min chart and the 5 min chart and we see stoch divergence then we are primed and ready to enter. Sadly, this is no exact science. You can set a limit order at the exact level of the previous S/R, or you can enter before the price reaches it with a wider S/L.
I would recommend an S/L of approx 15-20 pips.
ENTRY TOP TIPS
Please believe me when I tell you this-it will save you time and money and grey hairs.
1) If divergence is only showing on the 5 min chart but not the 15 min then DO NOT ENTER. I tried to make this work with just the 5 mins so I could get massive pips and with small S/L levels for great risk reward ratios and I can tell you this-you will get burned too often. So don't do it!
2) 15 min divergence is awesome. That's not a technical term is it, but I really have to make that point.
3) Don't overtrade, if you can't work out if an S/R level is important or not then it probably isn't. So don't try to convince yourself that it is.
Examples, with charts, to follow.
I'm writing this journal for two purposes. The first is to give back to the site after I've spent so long learning (as well as being distracted by if I'm honest) from it.
The second is less charitable-it's to make sure I document all my trades, both the good and the bad, so the embarassment/annoyance at taking an unplanned trade and having to share it will hopefully help my mental strength.
If no-one reads it then it's still all good as I'll still have to air my dirty linen, if only to myself.
It is no black box system so anyone who wants that then stop reading!
It is a rehash of pretty much most common sense stuff you might have read, but with my own comments that will hopefully make sense/give some guidance.
Note, just sticking with one currency pair is more than enough work, and will provide you with more than enough income. Don't try to analyse the £, $, yen etcetc, you just lose focus. Start with Eur/USD, it has low spreads and is volatile so it's all good.
What you need to do:
Learn about Support and Resistance levels.
http://www.nobrainertrades.com/2008/...ak-levels.html
Learn basic chart patterns (flag, bottom of the bucket etc
http://www.nobrainertrades.com/2008/...of-bucket.html
Learn the 4 types of stoch divergence shown here (the Type 1 and Type 2 diagrams are the most helpful)
http://www.elitetrader.com/tr/index....8&action=print
Learn how to draw trendlines.
Learn Fibonacci retracements. This is actually common sense with a fancy name. Reversals for a trend to continue tend to occur at the 50-62% retracement levels. I don't really draw them anymore.
The system:
I use Alpari UK Metatrader for charting
Chart setup: 8/2/2 stochastics on each timeframe EXCEPT FOR 1 MINUTE CHART-NO INDICATORS ON THIS TIMEFRAME.
Price field set to low/high, MA method-Linear Weighted
Price set to OHLC bars (you can use candlesticks if you prefer it).
3 timeframes per pair: 1 hour, 15 mins, 5 mins
So now, it's all set up.
To start with, look at the 1 hour chart, and also have a brief flip onto the 4 hour/1 day chart.
Draw lines of major Support and Resistance horizontally across the chart.
TOP TIP
Use a different colour line for the 4 hour/Daily S/R levels, these will be strong areas of interest, and as such should be given a different weighting+a quick way of identifying them to separate them from the 1 hour/15 min levels.
TOP TIP
The 1 hour chart is excellent-it's a long enough time frame to show where you are in the overall bigger trend, but is also an excellent tool for intraday trading. If you're getting a bit carried away looking at 5 min charts (try to avoid looking at them too much!) and all the changes of direction, look at the 1 hour chart- you'll calm down immediately.
TOP TIP
If you're not going to draw them in because there are so many lines (especially on the hourly chart) then be aware of the 50 and 00 price levels. Traders tend to want to hit them, it's kind of a sport, and prices can reverse in these areas, especially the 00 level.
Then draw the same levels of S/R on the 15 min chart.
Then draw the same levels of S/R on the 5 min chart.
This sounds like a lot of work, but it becomes second nature, and you'll breeze through it very quickly with practise.
Analysing the charts/the set up
So after all that, what are we doing, what's the point of all this?
It's simple, price tends to react at S/R levels. If price approaches resistance, it tends to retreat/go lower.
If price approaches support, it tends to bounce up.
But of course, this is not guaranteed to occur.
So what tools do we have that can predict more accurately when these reactions will occur at these S/R levels?
This is where stochastic divergence comes in. Used correctly, it is a VERY powerful tool.
So, armed with your S/R levels derived from your hourly chart, you watch and you wait.
We're looking for prices to approach these S/R levels, and when they do, we switch into stochastic divergence hunting mode.
So, if price is reaching a support level (a significant previous price low), and we look at the 15 min chart and the 5 min chart and we see stoch divergence then we are primed and ready to enter. Sadly, this is no exact science. You can set a limit order at the exact level of the previous S/R, or you can enter before the price reaches it with a wider S/L.
I would recommend an S/L of approx 15-20 pips.
ENTRY TOP TIPS
Please believe me when I tell you this-it will save you time and money and grey hairs.
1) If divergence is only showing on the 5 min chart but not the 15 min then DO NOT ENTER. I tried to make this work with just the 5 mins so I could get massive pips and with small S/L levels for great risk reward ratios and I can tell you this-you will get burned too often. So don't do it!
2) 15 min divergence is awesome. That's not a technical term is it, but I really have to make that point.
3) Don't overtrade, if you can't work out if an S/R level is important or not then it probably isn't. So don't try to convince yourself that it is.
Examples, with charts, to follow.