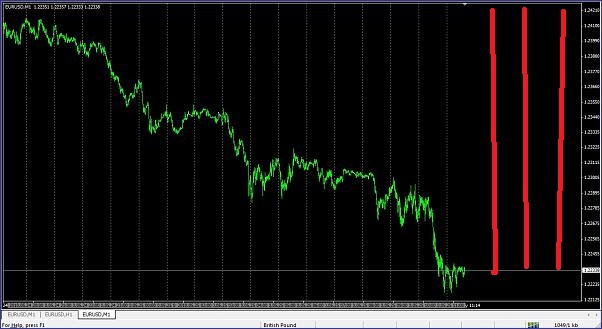
I use Time-vLines to draw vertical lines on the chart to mark various markets' opening and closing times. However, the indicator draws the lines on the bars and I would like them to be behind the bars so I can see all of the wicks. If I plot a non-indicator vertical line on the chart it is possible to have it displayed 'behind price' so I was wondering whether someone could help code the indicator to do the same with its vertical lines.
Attached is a chart with the indicator drawn line in yellow and 'hand-drawn' line in blue.
PS. I know I can always go to chart properties and select 'chart of foreground', but I don't want that.
Attached is a chart with the indicator drawn line in yellow and 'hand-drawn' line in blue.
PS. I know I can always go to chart properties and select 'chart of foreground', but I don't want that.
Attached Image

Attached File(s)
If you don't risk, you don't ever have to lose.