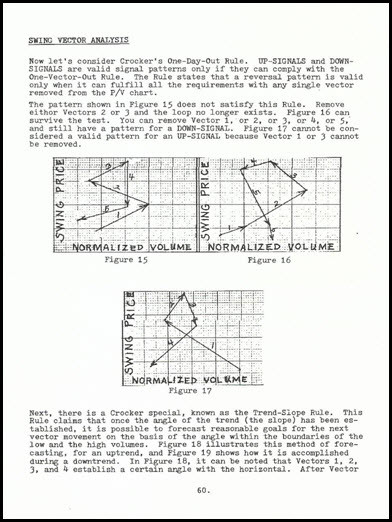
In the late 1970s Bruce Gould wrote a commodities market letter. I think it ran for 5-6 years or so.
In one of them was an article on the work of someone doing Vector Charts. They used connected vectors to track and analyze price + volume.
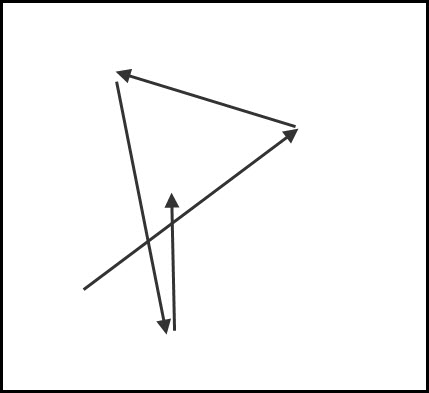
A conceptual sketch of what I recall they looked like.
I had the article copied but appear to have lost/misplaced it. Does anyone remember it/them - and/or have more information about them?
In one of them was an article on the work of someone doing Vector Charts. They used connected vectors to track and analyze price + volume.
A conceptual sketch of what I recall they looked like.
I had the article copied but appear to have lost/misplaced it. Does anyone remember it/them - and/or have more information about them?
Attached Image