I have two systems on my hands-both of them seem to work.
I've been trading the first, lets call it the "Quarters Trading System" (name changed to "Three Fours"), with good results. Trading it live for a penny a point, sometimes 2 pennies, and its been making me good pips. But it takes a bit more time than I would like, and I have this other thing that I want to trade, more just during peak hours. I basically want to limit my time spent on forex so I can spend more time on my other work activities, mainly building websites.
So, what I'm going to do in this journal is post the paper traded results of the Quarters system each day, and also show the live results from the other system, which I can trade a few hours once or twice a day.
Lets call the other system Micro-Happs, because thats essentially what it is. Its an intra-day trading system for the Eur/USD, which uses the same 60/40% mathematical relationship of my larger Happs charts, but its miniaturized for catching 20 to 30 pip intraday moves.
Unlike the Happs charts, this is not an indicator-this chart was made by hand.
Ultimately my goal in this journal is just to verify that these are indeed profitable systems, and then later I can move one or both of them up to the trading systems thread. So each day trade results will be posted-paper results for the Quarters system, and live results from the Micro-Happs system.
But lets get into more formal explanations and rules:
---------------------------------------------------------------------
Three Fours System:
This is kind of like Sixths trading, but for intraday. Its premise is that rejections off the previous day's high or low tend to produce strong moves back into the main trading area, and it attempts to capitalize on that tendency.
I divide my chart up into quarters. The 0% line is the low of the previous days trading. The 100% line is the high of the previous day's trading. Between these lines you have the 25%, 50%, and 75%.
Furthermore, below the 0% line you have the -25%, -50%, -75%, and negative 100%. Above the postive 100% line you have the 125%, 150%, 175%, and 200%.
This creates a total of 12 boxes on your chart. I create these boxes just by using altered fib settings.
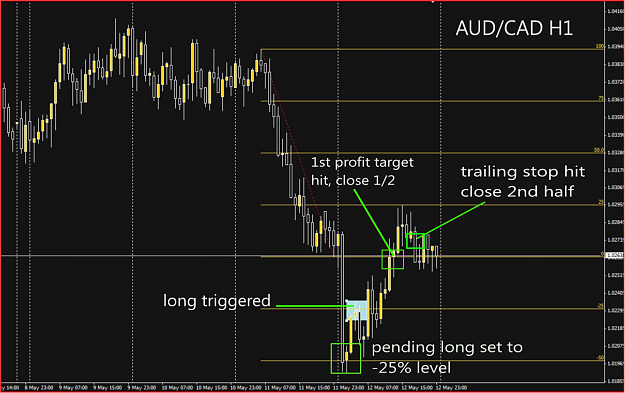
When price hits the 0% you set a pending buy at the 25% line.
When price hits the 100% you set a pending sell at the 75% line.
If price hits the 0% and continues down to the -25% without first moving up to the 25% line to trigger your buy, then the pending buy is simply moved down to the 0% line. And so on to -50%, -75%, and -100%. At -125% no -100% pending is set. A -75% pending, and a 175% pending are
the limits for setting pending trades.
Opposite for the positive numbers. Ie if it hits 125% without first triggering your sell at 75%, simply move the pending sell up to 100%. And so on up to the 200% level.
Those are the entry rules. SL can be 1.5 boxes. TP can be 1/2 taken at one box, and other half set to BE+2 at that point. If and When 2nd half gets 80 points into profit, trail it with a 30 point stop. For pairs with small ATR's, this 80 point number can be reduced. Still working on this.
Every point I make with each half of the entry will be counted as 1/2 pip. So we get real numbers at the end of the day.
Trading Times for Three Fours:
The system starts at 8PM EST. This is the start of the Asian session and marks the start of the new trading day on the East Coast. At that point you can put the Three Fours boxes on your charts according to the previous day's high and low data, and wait for the trades to set themselves up.
Trades are closed at 3PM EST the next day, 19 hours later. Not much happens from 3PM to 8PM. Over time you might get a break even result at best by leaving trades in past this point. So is better to give it a rest and close up shop for a little while each day.
Stop taking new trades after 1PM EST. There is no point opening a trade at 2PM that you're going to close at 3PM.
Revisions for Three Fours:
The only revisions made so far have to do with the exit rules for the second half of the trade. I found that putting a tight trailing stop on the second half of the trade too soon was costing me some pips on the big runners.
So second half TP rules were changed to BE+2 at 1 box, then trail with a 30 point stop once its 80 points into profit. Otherwise close it at the end of the day, 3PM EST.
Aside from that 3 pairs which showed no profit were removed from trading: GJPY, UCAD, and EURAUD. So the field is down to 10 from 13.
To see stats on profitiability of individual pairs after the first 7 trading days check this post:
http://www.forexfactory.com/showthre...33#post4634933
--------------------------------------------------------------
Micro-Happs System:
This chart as I said has been done by hand, and I worked it out mathematically. It uses the two phase, 60%/40% relationship for its structure, each phase having a mid. Yellow lines are the mid of the big phase, light brown lines are the mod of the small phase. Red lines are set between the yellow and brown lines.
Entry points are the Red lines. Occasionally you can enter on one of the yellow or brown lines, but for the most part, you really only want to enter on the red lines.
In addition to this the Red/Green TDI indicator is used. Exact rules for entry are as follows:
For a Long:
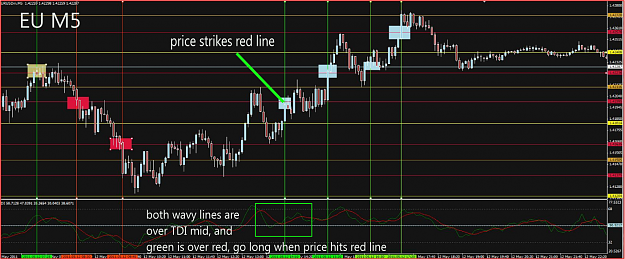
1)Both wavy TDI lines are above the middle line of the TDI indicator, which I've highlighted with a light blue horizontal line.
2)The green wavy line is above the red wavy line.
3)Price penetrates a red line on the Micro-Happs chart from below.
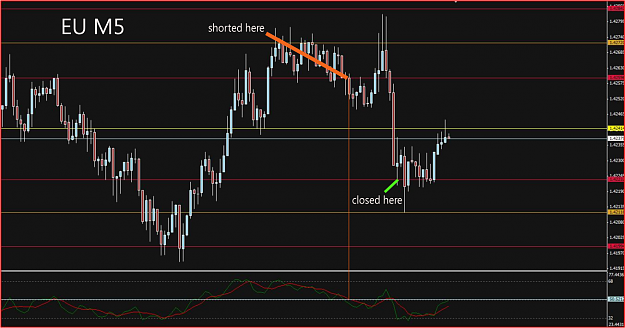
For a Short:
1)Both wavy TDI lines are below the middle line of the TDI indicator.
2)The red wavy line is above the green wavy line.
3)Price penetrates a red horizontal line on the Micro-Happs chart from above.
TP: try to get at least to the next red line on the other side of the yellow or brown mid. If momentum is good then just ride it.
SL: use common sense, its a 20-40 point goal per trade, so....
-----------------------------------------------------------------------
Ok so I'll put up some charts and yesterday's results for the Quarters system. Tomorrow I can start posting result for both.
-----------------------------------------------------------------------
Quarters System Results for 5/12/11
EOD is 3PM EST-no trades past this point til 8pm EST
Spread factored in...
Quarters being traded on the following pairs:
EU, EAud, EJ, GJ, GU, GC, GNZD, AU, ACad, AJ, NZUsd, NZJpy, UsdCad
EU: triggered long, EOD close +5
EA: triggered long, 1/2 taken at 1 box, half closed at BE+2, total +13
EJ: trigger long, 1/2 taken at 1 box, half closed EOD, total +20
GU: triggered long, close EOD -30
GC: Not triggered
GJ: triggered long, close EOD at BE
GZ: triggered long EOD, ignore (not triggered)
AU: triggered long, closed EOD +10
AUDCAD: triggered long, 1/2 taken 1 box, 1/2 hit trailing stop, total +36
AJPY: triggered long, 1/2 taken 1 box, 1/2 stopped BE+2, total +23
NZUSD: triggered long, 1/2 taken 1box, 1/2 hit trailing stop, total +54
NZDJPY: triggered long, 1/2 take 1 box, 1/2 hit trailing stop, total +17
USD/CAD: triggered short, closed EOD +12
_____________________________________________________________
Grand total: +158 pips
Avg: +11.2 pips per pair, +15.8 pips per pair traded
9 winners, 1 loser, 2 not triggered, 1 parity
-----------------------------------------------------------------------
Thoughts on these results:
Win ratio does seem to be high so far. Just one full stop loss would have dragged it down quite a lot though. The only observations I can make so far is that I'm losing some pips with the trailing stop. Wild swings stop 2nd half out before pushing higher. Taking half then setting rest to BE+2 with a 75 point target, or otherwise close at EOD might be a more profitable way to go. See how future trades go first.
-----------------------------------------------------------------------
There is no real template to provide with the Quarters system. Just alter your fibs for the inputs I described earlier, and set them on the previous days range, 0 at the low point, 100% at the high. Thats it, your set.
I'll provide one anyway-I'm just not sure that the fib settings I include will carry over into the template if your fib settings aren't the same. But just in case they do, I'll inlcude one so you can see how the fib settings have been altered. If they don't carry over, then you'll have to alter you're own fib settings and apply the fibs to the chart yourself.
The Quarters template example is for the AUD/CAD.
----------------------------------------------------------------------
The Micro-Happs chart of course does have a template, which I guess I'll provide...
On the Micro-Happs template there are a number of squares and vertical lines which I've placed to show valid entry points. Blue square for long, red square for short, and one Kakhi colored square to show a long entry that was no good. After you get the idea, just go to the objects list on your chart and delete the vertical lines and squares. Do Not delete any horizontal lines. You will need those. Also Micro Happs is a 5 Min chart system, so put it on the 5 MIN EU chart.
Probable Ideal Times for trading Micro Happs:
Possibley Asian session. Probably not Frankfurt open. London Open, and USA open good. You basically need good energy to take you through the lines, but not crazy trading like Frankfurt can get. Sometimes Asian has it, sometimes not. Lon/O and USA/O have it.
The yellow and brown mids on the micro-happs chart are like stopping points when momentum is bad, and acellerators when momentum is good. So to trade Asian session, I reccomend you observe first and make sure there is enough activity going on, or otherwise only go for very small scalps, ie red line to the mid, instead of red line to the next red line.
Please Remember these are not fully verified systems, only promising ones. I myself trade them for only a penny per point. I suggest if you want to trade them to either demo or to trade for no more than 1 penny per point until these have been more proven, and you get the hang of them.
Ex charts, indi, and template posted below. Top Chart is Micro-Happs Example, bottom chart is Quarters system Example.
--------------------------------------------------------------------------------------------------------------------------------
I've been trading the first, lets call it the "Quarters Trading System" (name changed to "Three Fours"), with good results. Trading it live for a penny a point, sometimes 2 pennies, and its been making me good pips. But it takes a bit more time than I would like, and I have this other thing that I want to trade, more just during peak hours. I basically want to limit my time spent on forex so I can spend more time on my other work activities, mainly building websites.
So, what I'm going to do in this journal is post the paper traded results of the Quarters system each day, and also show the live results from the other system, which I can trade a few hours once or twice a day.
Lets call the other system Micro-Happs, because thats essentially what it is. Its an intra-day trading system for the Eur/USD, which uses the same 60/40% mathematical relationship of my larger Happs charts, but its miniaturized for catching 20 to 30 pip intraday moves.
Unlike the Happs charts, this is not an indicator-this chart was made by hand.
Ultimately my goal in this journal is just to verify that these are indeed profitable systems, and then later I can move one or both of them up to the trading systems thread. So each day trade results will be posted-paper results for the Quarters system, and live results from the Micro-Happs system.
But lets get into more formal explanations and rules:
---------------------------------------------------------------------
Three Fours System:
This is kind of like Sixths trading, but for intraday. Its premise is that rejections off the previous day's high or low tend to produce strong moves back into the main trading area, and it attempts to capitalize on that tendency.
I divide my chart up into quarters. The 0% line is the low of the previous days trading. The 100% line is the high of the previous day's trading. Between these lines you have the 25%, 50%, and 75%.
Furthermore, below the 0% line you have the -25%, -50%, -75%, and negative 100%. Above the postive 100% line you have the 125%, 150%, 175%, and 200%.
This creates a total of 12 boxes on your chart. I create these boxes just by using altered fib settings.
When price hits the 0% you set a pending buy at the 25% line.
When price hits the 100% you set a pending sell at the 75% line.
If price hits the 0% and continues down to the -25% without first moving up to the 25% line to trigger your buy, then the pending buy is simply moved down to the 0% line. And so on to -50%, -75%, and -100%. At -125% no -100% pending is set. A -75% pending, and a 175% pending are
the limits for setting pending trades.
Opposite for the positive numbers. Ie if it hits 125% without first triggering your sell at 75%, simply move the pending sell up to 100%. And so on up to the 200% level.
Those are the entry rules. SL can be 1.5 boxes. TP can be 1/2 taken at one box, and other half set to BE+2 at that point. If and When 2nd half gets 80 points into profit, trail it with a 30 point stop. For pairs with small ATR's, this 80 point number can be reduced. Still working on this.
Every point I make with each half of the entry will be counted as 1/2 pip. So we get real numbers at the end of the day.
Trading Times for Three Fours:
The system starts at 8PM EST. This is the start of the Asian session and marks the start of the new trading day on the East Coast. At that point you can put the Three Fours boxes on your charts according to the previous day's high and low data, and wait for the trades to set themselves up.
Trades are closed at 3PM EST the next day, 19 hours later. Not much happens from 3PM to 8PM. Over time you might get a break even result at best by leaving trades in past this point. So is better to give it a rest and close up shop for a little while each day.
Stop taking new trades after 1PM EST. There is no point opening a trade at 2PM that you're going to close at 3PM.
Revisions for Three Fours:
The only revisions made so far have to do with the exit rules for the second half of the trade. I found that putting a tight trailing stop on the second half of the trade too soon was costing me some pips on the big runners.
So second half TP rules were changed to BE+2 at 1 box, then trail with a 30 point stop once its 80 points into profit. Otherwise close it at the end of the day, 3PM EST.
Aside from that 3 pairs which showed no profit were removed from trading: GJPY, UCAD, and EURAUD. So the field is down to 10 from 13.
To see stats on profitiability of individual pairs after the first 7 trading days check this post:
http://www.forexfactory.com/showthre...33#post4634933
--------------------------------------------------------------
Micro-Happs System:
This chart as I said has been done by hand, and I worked it out mathematically. It uses the two phase, 60%/40% relationship for its structure, each phase having a mid. Yellow lines are the mid of the big phase, light brown lines are the mod of the small phase. Red lines are set between the yellow and brown lines.
Entry points are the Red lines. Occasionally you can enter on one of the yellow or brown lines, but for the most part, you really only want to enter on the red lines.
In addition to this the Red/Green TDI indicator is used. Exact rules for entry are as follows:
For a Long:
1)Both wavy TDI lines are above the middle line of the TDI indicator, which I've highlighted with a light blue horizontal line.
2)The green wavy line is above the red wavy line.
3)Price penetrates a red line on the Micro-Happs chart from below.
For a Short:
1)Both wavy TDI lines are below the middle line of the TDI indicator.
2)The red wavy line is above the green wavy line.
3)Price penetrates a red horizontal line on the Micro-Happs chart from above.
TP: try to get at least to the next red line on the other side of the yellow or brown mid. If momentum is good then just ride it.
SL: use common sense, its a 20-40 point goal per trade, so....
-----------------------------------------------------------------------
Ok so I'll put up some charts and yesterday's results for the Quarters system. Tomorrow I can start posting result for both.
-----------------------------------------------------------------------
Quarters System Results for 5/12/11
EOD is 3PM EST-no trades past this point til 8pm EST
Spread factored in...
Quarters being traded on the following pairs:
EU, EAud, EJ, GJ, GU, GC, GNZD, AU, ACad, AJ, NZUsd, NZJpy, UsdCad
EU: triggered long, EOD close +5
EA: triggered long, 1/2 taken at 1 box, half closed at BE+2, total +13
EJ: trigger long, 1/2 taken at 1 box, half closed EOD, total +20
GU: triggered long, close EOD -30
GC: Not triggered
GJ: triggered long, close EOD at BE
GZ: triggered long EOD, ignore (not triggered)
AU: triggered long, closed EOD +10
AUDCAD: triggered long, 1/2 taken 1 box, 1/2 hit trailing stop, total +36
AJPY: triggered long, 1/2 taken 1 box, 1/2 stopped BE+2, total +23
NZUSD: triggered long, 1/2 taken 1box, 1/2 hit trailing stop, total +54
NZDJPY: triggered long, 1/2 take 1 box, 1/2 hit trailing stop, total +17
USD/CAD: triggered short, closed EOD +12
_____________________________________________________________
Grand total: +158 pips
Avg: +11.2 pips per pair, +15.8 pips per pair traded
9 winners, 1 loser, 2 not triggered, 1 parity
-----------------------------------------------------------------------
Thoughts on these results:
Win ratio does seem to be high so far. Just one full stop loss would have dragged it down quite a lot though. The only observations I can make so far is that I'm losing some pips with the trailing stop. Wild swings stop 2nd half out before pushing higher. Taking half then setting rest to BE+2 with a 75 point target, or otherwise close at EOD might be a more profitable way to go. See how future trades go first.
-----------------------------------------------------------------------
There is no real template to provide with the Quarters system. Just alter your fibs for the inputs I described earlier, and set them on the previous days range, 0 at the low point, 100% at the high. Thats it, your set.
I'll provide one anyway-I'm just not sure that the fib settings I include will carry over into the template if your fib settings aren't the same. But just in case they do, I'll inlcude one so you can see how the fib settings have been altered. If they don't carry over, then you'll have to alter you're own fib settings and apply the fibs to the chart yourself.
The Quarters template example is for the AUD/CAD.
----------------------------------------------------------------------
The Micro-Happs chart of course does have a template, which I guess I'll provide...
On the Micro-Happs template there are a number of squares and vertical lines which I've placed to show valid entry points. Blue square for long, red square for short, and one Kakhi colored square to show a long entry that was no good. After you get the idea, just go to the objects list on your chart and delete the vertical lines and squares. Do Not delete any horizontal lines. You will need those. Also Micro Happs is a 5 Min chart system, so put it on the 5 MIN EU chart.
Probable Ideal Times for trading Micro Happs:
Possibley Asian session. Probably not Frankfurt open. London Open, and USA open good. You basically need good energy to take you through the lines, but not crazy trading like Frankfurt can get. Sometimes Asian has it, sometimes not. Lon/O and USA/O have it.
The yellow and brown mids on the micro-happs chart are like stopping points when momentum is bad, and acellerators when momentum is good. So to trade Asian session, I reccomend you observe first and make sure there is enough activity going on, or otherwise only go for very small scalps, ie red line to the mid, instead of red line to the next red line.
Please Remember these are not fully verified systems, only promising ones. I myself trade them for only a penny per point. I suggest if you want to trade them to either demo or to trade for no more than 1 penny per point until these have been more proven, and you get the hang of them.
Ex charts, indi, and template posted below. Top Chart is Micro-Happs Example, bottom chart is Quarters system Example.
--------------------------------------------------------------------------------------------------------------------------------
Attached Image(s) (click to enlarge)
Attached File(s)