Hello everybody
I'm starting this thread mainly in order to share my very simple yet effective trading system which uses PA alongside with only a single EMA and a standard Stochastic indicator for guidance. The second idea behind building this thread is to track my personal trades and get others' suggestions about it to improve it .. so this thread acts somehow like an interactive journal too so I invite everybody to join the discussion about this method and of course I welcome any suggestions about this system and will appreciate your contribution.
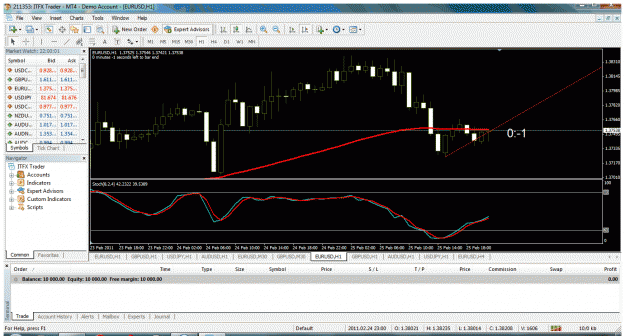
The main tools used in this system is a 70 EMA (close) and a stochastic (8,2,4) which mainly help us to determine the trend direction (using EMA) and OB - OS condition of the market.
EMA 70 (close) is used to identify the main trend direction but also a signal line for us to enter or exit our positions. Stochastic is used to verify if the market is in OS or OB condition to either close a position partially or to add another position in the direction of the market trend.
However the main tool which we will use mostly is PA. You have to know only few basic candlestick patterns which have more weight like Pinbars, bullish & bearish engulfing, dark cloud, hanging man, hammer, morning star and evening star formation.
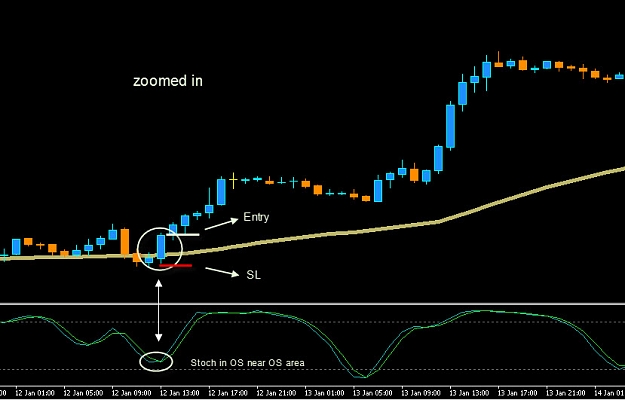
Of course because we are dealing with stochastic, other definitions like divergences and OB OS conditions will be discussed and you need to already know the basic things about them because they help a lot by means of deciding to open or close positions.
These patterns repeat over and over in every market and you could find them in every time frame but we know the higher the time frame the more weight these patterns will have ... so we use H1 time frame to be not so long term like daily and not so whipsaw mode like 5M ... so we will stay with the middle yet effective time frame. Now:
Tools:
1- EMA 70 (close)
2- Stochastic (8,2,4)
Rules:
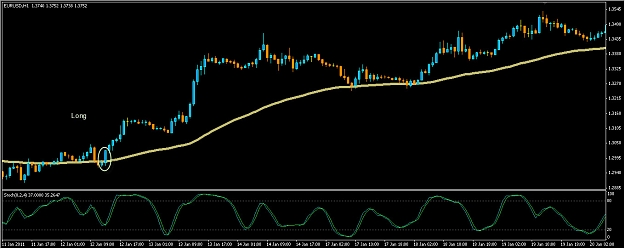
1- We enter a position (either long or short) as soon as a candle "closes" above or below the EMA 70 ... so we go long if market is below EMA and then a candle closes above EMA 70 and vice versa for with a candle close below EMA to go short.
2- we place SL right below the low of the candle that closed above EMA (for long positions) and high+spread of the candle that closed below EMA (for short positions).
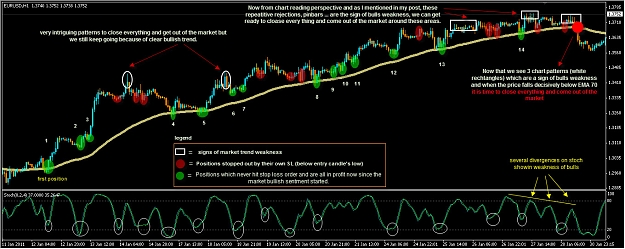
3- In the matter of setting TP I rather act arbitrary i.e it depends of the strength of the trend and I'll keep the positions open until a significant PA appears on chart or finally a candle closes at the other side of the EMA. because this part needs some graphical examples we will discuss it more later.
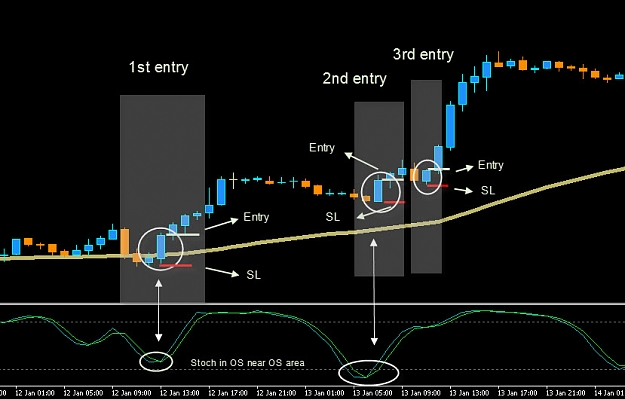
4- The main advantage of this system is it's patience behind it and waiting for big results not going for 50 - 60 pips profits. The basic to gain such results is adding to positions based current market trend and using PA (as entering signal) and stochastic (as guide). I'll elaborate it more with examples.
Cheers
I'm starting this thread mainly in order to share my very simple yet effective trading system which uses PA alongside with only a single EMA and a standard Stochastic indicator for guidance. The second idea behind building this thread is to track my personal trades and get others' suggestions about it to improve it .. so this thread acts somehow like an interactive journal too so I invite everybody to join the discussion about this method and of course I welcome any suggestions about this system and will appreciate your contribution.
The main tools used in this system is a 70 EMA (close) and a stochastic (8,2,4) which mainly help us to determine the trend direction (using EMA) and OB - OS condition of the market.
EMA 70 (close) is used to identify the main trend direction but also a signal line for us to enter or exit our positions. Stochastic is used to verify if the market is in OS or OB condition to either close a position partially or to add another position in the direction of the market trend.
However the main tool which we will use mostly is PA. You have to know only few basic candlestick patterns which have more weight like Pinbars, bullish & bearish engulfing, dark cloud, hanging man, hammer, morning star and evening star formation.
Of course because we are dealing with stochastic, other definitions like divergences and OB OS conditions will be discussed and you need to already know the basic things about them because they help a lot by means of deciding to open or close positions.
These patterns repeat over and over in every market and you could find them in every time frame but we know the higher the time frame the more weight these patterns will have ... so we use H1 time frame to be not so long term like daily and not so whipsaw mode like 5M ... so we will stay with the middle yet effective time frame. Now:
Tools:
1- EMA 70 (close)
2- Stochastic (8,2,4)
Rules:
1- We enter a position (either long or short) as soon as a candle "closes" above or below the EMA 70 ... so we go long if market is below EMA and then a candle closes above EMA 70 and vice versa for with a candle close below EMA to go short.
2- we place SL right below the low of the candle that closed above EMA (for long positions) and high+spread of the candle that closed below EMA (for short positions).
3- In the matter of setting TP I rather act arbitrary i.e it depends of the strength of the trend and I'll keep the positions open until a significant PA appears on chart or finally a candle closes at the other side of the EMA. because this part needs some graphical examples we will discuss it more later.
4- The main advantage of this system is it's patience behind it and waiting for big results not going for 50 - 60 pips profits. The basic to gain such results is adding to positions based current market trend and using PA (as entering signal) and stochastic (as guide). I'll elaborate it more with examples.
Cheers
Discipline + Patience - Fear - Greed = Success