HI ALL. Some notes about US$-Index [bad English, sorry http://cdn.forexfactory.com/images/icons/icon9.gif ]
Financial Markets Observatory Lab.
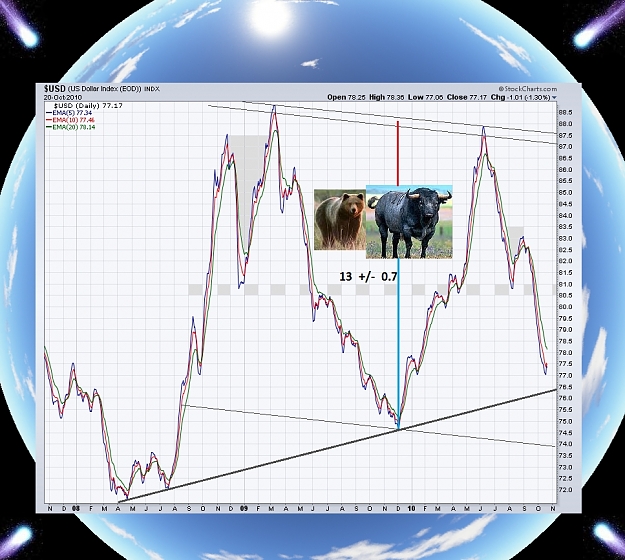
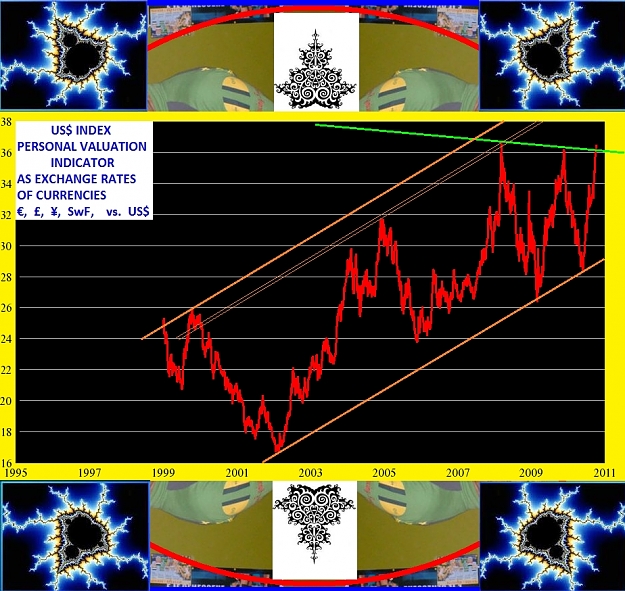
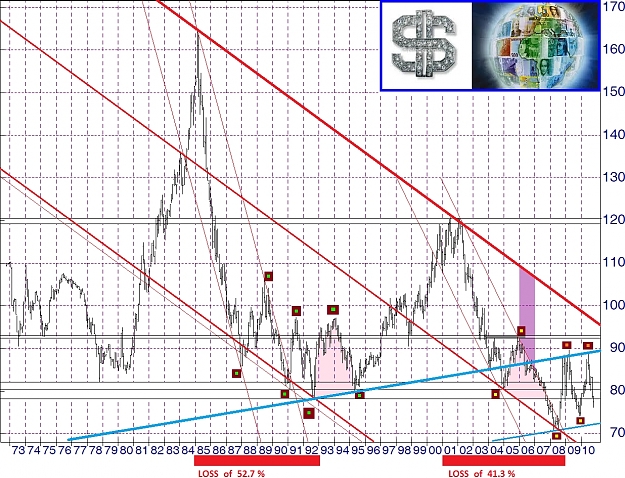
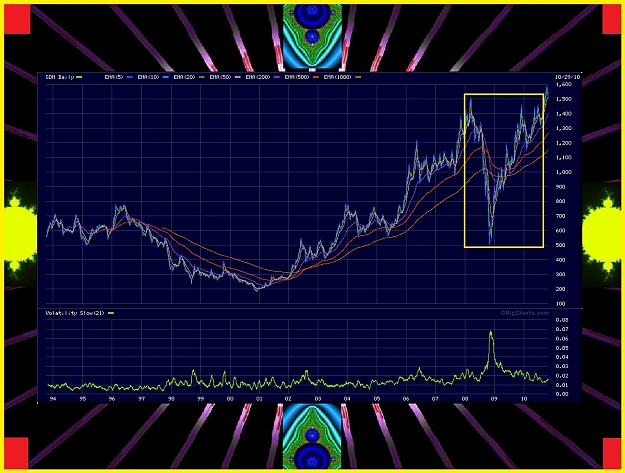
This chart is ema-format 3y of US$. The following notes maybe reported:
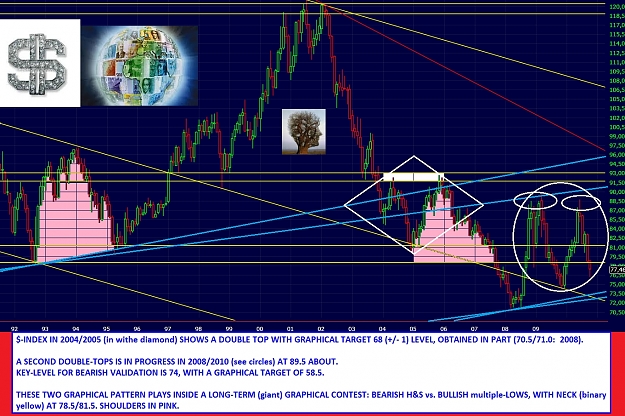
the graphical contest bullish H&S vs. descending double-tops (neck-area now at 87.0/87.5) was broken in favor of the bearish double-tops at 81-level about (gray-markers). If this structure will be seen from the market then the target could be head price-area from dec.09-low, 61.5, in according to previous P&F.
An important graphical pit-stop there will be at 74-level, parallel to neck-line, but also to 3y-ascending line at 76.5/77.0 level; below this cone a sell-off is probable.
Tuned on Forex-War.
It is very important do not anticipate the main trend of the underlying financial instruments.
previous big chart in candles-format
I.M.O. by $@!Ψ¥
Financial Markets Observatory Lab.
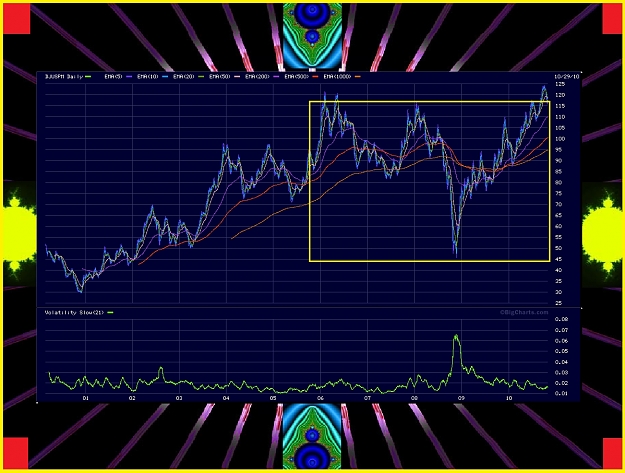
This chart is ema-format 3y of US$. The following notes maybe reported:
the graphical contest bullish H&S vs. descending double-tops (neck-area now at 87.0/87.5) was broken in favor of the bearish double-tops at 81-level about (gray-markers). If this structure will be seen from the market then the target could be head price-area from dec.09-low, 61.5, in according to previous P&F.
An important graphical pit-stop there will be at 74-level, parallel to neck-line, but also to 3y-ascending line at 76.5/77.0 level; below this cone a sell-off is probable.
Tuned on Forex-War.
It is very important do not anticipate the main trend of the underlying financial instruments.
previous big chart in candles-format
I.M.O. by $@!Ψ¥
Attached Image (click to enlarge)