This is somewhat interesting. Maybe you'll find it so as well.
This appears to be the "De-Coupling" of the carry/equity/yen trade that has
been mentioned recently. At first, I couldn't see it. I couldn't even see a reason for it.
The correlation of the "Uni-trade" (all roads lead to the carry-trade) just seems like
a natural phenomenon after all these years of winding (and unwinding).
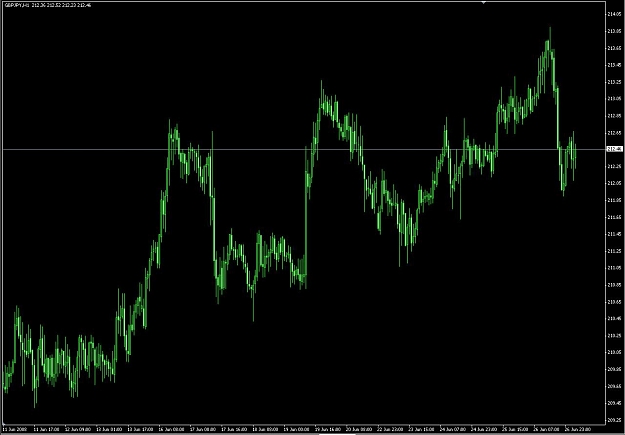
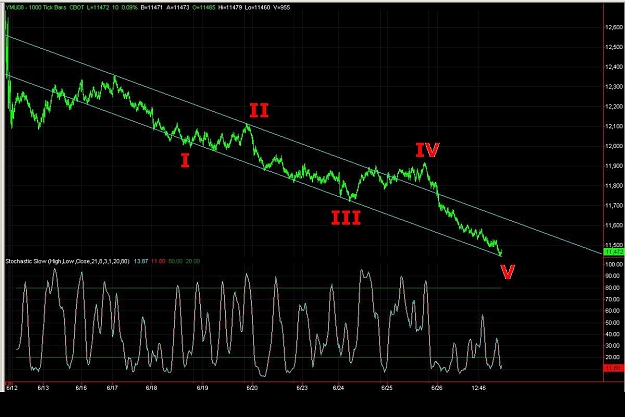
Look at the Dow (we do have 5 clean waves down as of today so, don't sell ALL your stocks yet),
and then look at Geppy. Peaks and troughs are still correlating, but the two charts
are telling two very different stories. They may not be lined up proportionately
because the Sept Dow futures is a 1000 tick chart and the GBP/JPY is an hourly,
but use your imagination and you can see the peaks and troughs during the past month.
This appears to be the "De-Coupling" of the carry/equity/yen trade that has
been mentioned recently. At first, I couldn't see it. I couldn't even see a reason for it.
The correlation of the "Uni-trade" (all roads lead to the carry-trade) just seems like
a natural phenomenon after all these years of winding (and unwinding).
Look at the Dow (we do have 5 clean waves down as of today so, don't sell ALL your stocks yet),
and then look at Geppy. Peaks and troughs are still correlating, but the two charts
are telling two very different stories. They may not be lined up proportionately
because the Sept Dow futures is a 1000 tick chart and the GBP/JPY is an hourly,
but use your imagination and you can see the peaks and troughs during the past month.
Attached Image(s) (click to enlarge)