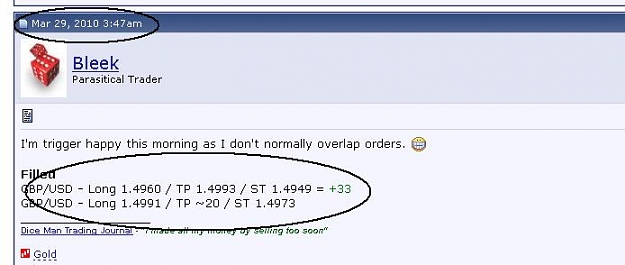
Disliked@Bleek
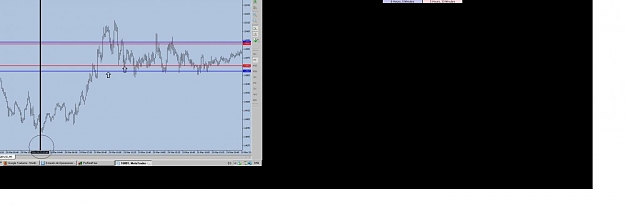
What a kind of 5 min chart you are looking? Candle, line?
Can you express yours self what kind of momentum you are looking for, please?
rgdsIgnored
Describe momentum, that is a tough one, it's a mental gauge of the market at any given moment.
Think of the market 'shape' as an endurance event, there are peaks and troughs of excitement but when the energy levels drop the price collects itself and gathers energy for the next move. Don't try and plot or plan a future move based on previous patterns, look at how price is building or falling over a period of time and it how it reacted previously.
You don't need a solid straight line through a chart to identify any form of support, price will congest in a range, price will float in a zone. Of course draw lines if it helps but I'd suggest large and round numbers only for a start, observe the interaction between these ranges. A pretty basic concept but many fail to master.
"I made all my money by selling too soon"