Hi there,
I would like to share my trading idea. I'm still not concerned as to place where should I post, however one of reasons why I post is some evaluation and advices from you guys, therefore I choose Trading Systems.
Time:
I trade it between 8:00 and 10:30 GMT+1 [European time], however I use exactly same 1M rules when trading on news release.
Preparation for trading:
Before I open my 1M chart, I watch first M30 to see what trend is, and was there any retracement shortly before session begins, or should I expect one soon. E.g. if there was move down on uptrend during asian session, I decide how far up price should move up to convince me that it's back on it's way up.
than daily to see if price is on trend or range, is it top or bottom of channel, or near some trend line, just to confirm what I saw on M30.
Example of such an analysis is here on my blog:
fx-sniper
When I prepare for news trading, apart of some current S/R levels I do research on historical charts related to previous release. What I search for is
-did release moved price any direction?
-was there spike in the begining?
-was spike shadowed back?
-was there move back to prerelease value?
-did price turned back later after release [30-60 minutes] did it eventually returned to prerelease values?
When research is done I use mechanical part of a system.
On my 1M charts you can see:
BB 18
StochRSI
HeikenAshi Smoothed [0,1,3,2]
GREEN AND RED LINE for top and bottom of a price range between 23:01 [prev day] and 07:00
grey box marking top and bottom between 6 and 8 am GMT+1
Note that my chart is timed in GMT+2 what may be a bit confusing - please ignore it
Entry short:
picture shows the best.
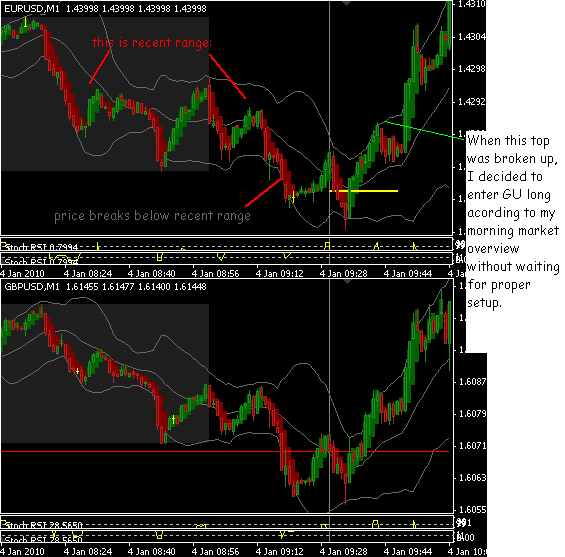
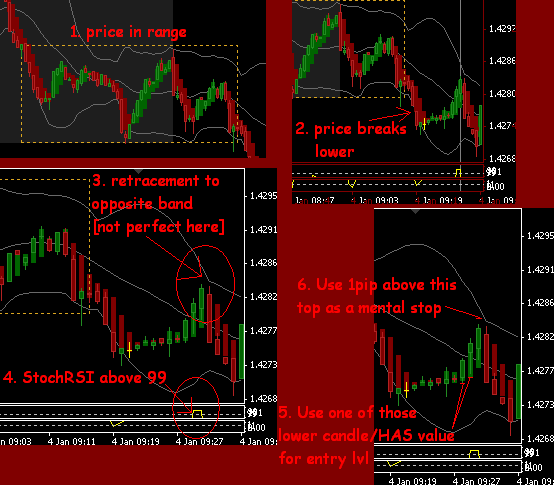
First and foremost, I wait for price to break below recent range, or set new low.
Than I wait for it to retrace to upper band coordinated with StochRSI above 99.
When this happens my entry level is the lowest bottom of one of recent 2-3 green candles with green HAS. this is a bit discretional where this level should be, but it shouldn't be too close to current price. hopefully picture shows the best.
SL is 1 pip above recent top or bottom [usually around 8-12 pips], however I set not higher than 15 pips on EU EJ and GU, and not more than 28 on GJ.
TP I take half around 20 pips [30 on GJ] and wait with the rest [usually watch tops and bottoms, some important levels etc].
On attached picture there is another trade - long GU marked. I don't discuss it here as I did not follow exact entry rules, however I did it as I expect GU bounce off red line as one scenario [you can read it in my blog], aditionally similar PA on EU was kinda confirmation for trade long.
PS. Please feel free to ask, as it may sound a bit complicated, I will post tpl and indicators later today.
I would like to share my trading idea. I'm still not concerned as to place where should I post, however one of reasons why I post is some evaluation and advices from you guys, therefore I choose Trading Systems.
Time:
I trade it between 8:00 and 10:30 GMT+1 [European time], however I use exactly same 1M rules when trading on news release.
Preparation for trading:
Before I open my 1M chart, I watch first M30 to see what trend is, and was there any retracement shortly before session begins, or should I expect one soon. E.g. if there was move down on uptrend during asian session, I decide how far up price should move up to convince me that it's back on it's way up.
than daily to see if price is on trend or range, is it top or bottom of channel, or near some trend line, just to confirm what I saw on M30.
Example of such an analysis is here on my blog:
fx-sniper
When I prepare for news trading, apart of some current S/R levels I do research on historical charts related to previous release. What I search for is
-did release moved price any direction?
-was there spike in the begining?
-was spike shadowed back?
-was there move back to prerelease value?
-did price turned back later after release [30-60 minutes] did it eventually returned to prerelease values?
When research is done I use mechanical part of a system.
On my 1M charts you can see:
BB 18
StochRSI
HeikenAshi Smoothed [0,1,3,2]
GREEN AND RED LINE for top and bottom of a price range between 23:01 [prev day] and 07:00
grey box marking top and bottom between 6 and 8 am GMT+1
Note that my chart is timed in GMT+2 what may be a bit confusing - please ignore it
Entry short:
picture shows the best.
First and foremost, I wait for price to break below recent range, or set new low.
Than I wait for it to retrace to upper band coordinated with StochRSI above 99.
When this happens my entry level is the lowest bottom of one of recent 2-3 green candles with green HAS. this is a bit discretional where this level should be, but it shouldn't be too close to current price. hopefully picture shows the best.
SL is 1 pip above recent top or bottom [usually around 8-12 pips], however I set not higher than 15 pips on EU EJ and GU, and not more than 28 on GJ.
TP I take half around 20 pips [30 on GJ] and wait with the rest [usually watch tops and bottoms, some important levels etc].
On attached picture there is another trade - long GU marked. I don't discuss it here as I did not follow exact entry rules, however I did it as I expect GU bounce off red line as one scenario [you can read it in my blog], aditionally similar PA on EU was kinda confirmation for trade long.
PS. Please feel free to ask, as it may sound a bit complicated, I will post tpl and indicators later today.
Attached Image