Hi,
Recently been looking at the charts and would like to see if any one would like to create this. See attached file.
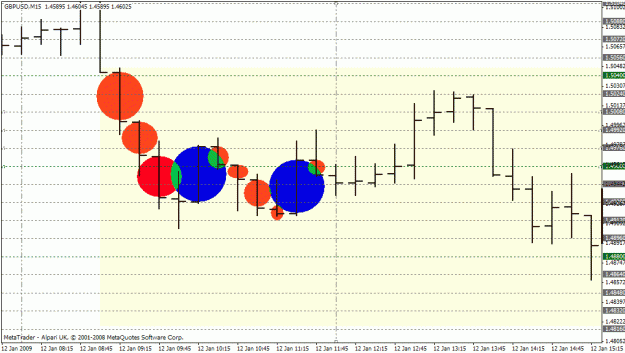
It should draw circles red down and blue up at the open price to the close price of each bar in any time frame up to 15 min.
The charts would then be represented by a series of coloured circles.
It would be impossible for me to do this by hand and would appreciate it if anyone could give it a go.
Many thanks
Slimcat
Recently been looking at the charts and would like to see if any one would like to create this. See attached file.
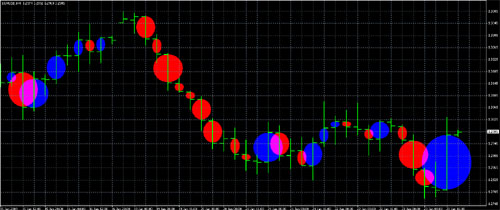
It should draw circles red down and blue up at the open price to the close price of each bar in any time frame up to 15 min.
The charts would then be represented by a series of coloured circles.
It would be impossible for me to do this by hand and would appreciate it if anyone could give it a go.
Many thanks
Slimcat
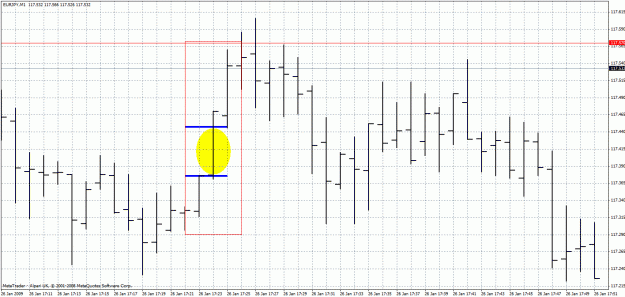
Attached Image (click to enlarge)