I like anything Stochastic and any combination thereof. You will find that learning to use mutliple Stochastics both within the same Time Frame and across two or more Time Frames is very helpful to gauging trend reversals, price exhaustion and continuation of a trend.
I will be real simple with this method at the start.
attached is a template
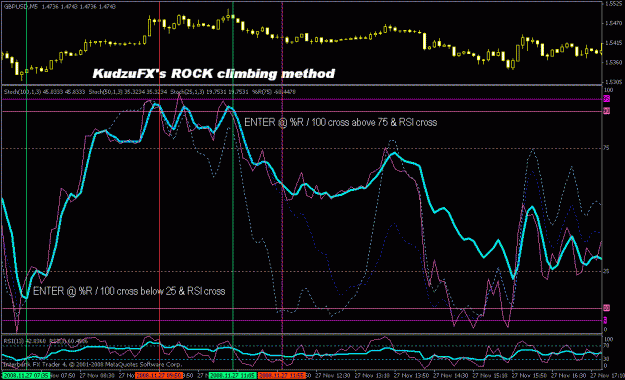
Kuduz's ROcK climbing stands for
R williams
Oscillator
c=with
K line Stochastics
entry:
cross of %R with 100%K line (aqua)
and
cross of RSI lines
and
convergence of multiple Stochastic lines
good = <25 or >75
better = <10 or >90
best = <5 or >95
exit:
when the 25 Stochastic line crosses and turns the other way
or
when the 100 %K lines cross the 10 or 90 line
or
whenever you got the pips you want (best to aim for 5 to 30)
I will be real simple with this method at the start.
attached is a template
Kuduz's ROcK climbing stands for
R williams
Oscillator
c=with
K line Stochastics
entry:
cross of %R with 100%K line (aqua)
and
cross of RSI lines
and
convergence of multiple Stochastic lines
good = <25 or >75
better = <10 or >90
best = <5 or >95
exit:
when the 25 Stochastic line crosses and turns the other way
or
when the 100 %K lines cross the 10 or 90 line
or
whenever you got the pips you want (best to aim for 5 to 30)
Attached Image (click to enlarge)
Attached File(s)