***Newly updated template***
This trading theory is based on approaching the markets dynamically. Because the market dynamics are always changing, for example a simple 20 pip stop loss on the 5 min won't be the best thing all the time because the volatility changes. In the past month we have seen insane volatility, and I imagine people that were using a set stop loss have run into problems, It makes sense that they would.
I don't know If anyone could program anything from this template and approach.... Any ideas with that let me know!
So here goes:
I will try to spend as little time as possible on the entry techniques, and more on the position sizing and exit techniques, which are the only real way determine the outcome of your trade...
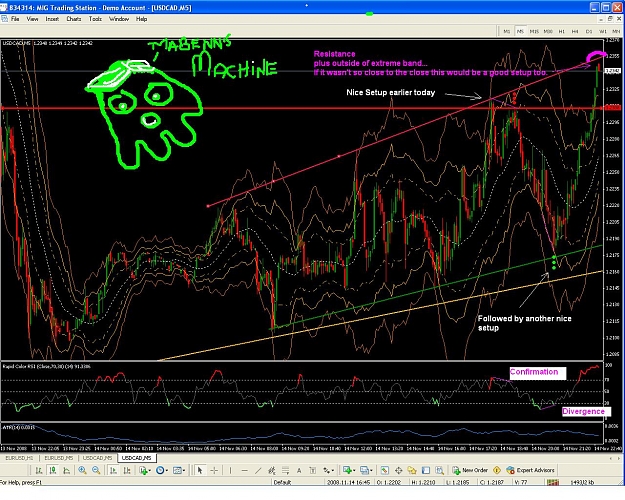
I have plotted 3 Keltner channels, All of them are plotted around a 20 period MA (invisible), with the first being drawn as a deviation envelope of 1.618, the second @2.618 and the 2rd @ 4.236, in accordance with Fibonacci fun.
It might work just as well to use a 2, 3, and 4 deviation but using magic numbers seems to envelope most of the price action and give the best zones to look for when placing trades. Plus... They're Magic Numbers, so it's almost as good as having a crystal ball on your desk.
Market's trade in these stages:
Up and Volatile,
Up and quiet
Sideways and Volatile
Sideways and quiet
Down and Volatile
Down and Quiet.
Knowing how to react in all situations is key, or knowing how your system reacts... but in the end, you are your system no?
The Rapid Colored RSI is there to look for covergence (confirming price action), and divergence patterns. If you don't know what that is there's a great page to study on how it can be usefull which includes several articles:
http://www.trading-naked.com/Divergence.htm
When the market is moving Up and Volatile , or down and volatile hopefully you have already received a signal or found a good place to go long/short and are still in your position but... Look for pullbacks into the zone between the white center mov avg (21 ema) and the gold dotted keltner channel. (or the 5ema - See Philip Nel's 5 min strategy)
When the market is up and quiet, or down and quiet the bands should be tighter, so you might look for pullbacks into the first set of bands opposite the trend direct, pullbacks into the 5/21 ema zone, or just pullbacks that are backed by support/resistance the key here being to follow the trend!!! Watch for OB/OS on the rapid RSI.
Sidways and Volatile, Look for pullbacks between the 1.618 and 4.236, with the best signals between the 2 outer bands for areas to go long/short. Confirm with RSI, either OB/OS or Divergence patterns. Trade the extremes of the sideways channel.
Sideways and quiet, look for pullbacks between the 2 innner bands (1.618 and 2.618) for areas to go long and short. Watch for OB/OS on the RSI.
The ATR is there to use for your stop loss, and for an eyeball measurment of volatility confirmation - See the Position sizing calculator on the next page for using the RSI as a stop loss measurement!
I have found that 2x the ATR can provide an excellent stop that isn't too far away to create good risk reward ratio's while still being outside of the noise of the market, which is 1xATR.
Note for mt4 programmers: I would rather have the ATR displayed on my chart screen like so: 1x ATR="", 2xATR ="" 3xATR="" etc. Instead of looking at the line and atr and multiplying it. If someone has the ability to program this that would be awesome to see and use!
RSI: If the rapid RSI is coverging (confirming) or diverging these are two things to watch for, it will always do both (duh)... Converging is confirming price actions, so if you are buying on a dip of a trend and RSI is confirming the price action, it's a safer spot - It is better if RSI is diverging on the dip, but you might have to zoom in to smaller time frames, for me that would be the 1 min chart.
So if it diverging from price in a sideways market, that could mean an excellent place to go long/short, if it is converging with a trend, that pullback is an excellent safe place to go long/short, if it is diverging in a trend, there will probably be 2-5 divergences before the trend does a major correction or changes. Sometimes there is excellent patterns when you see the first divergence, followed by a pullback with convergence. This also works for the second divergence/convergence patterns. If this is confusing read the trading Naked article. I think this is pretty self explanatory.
The colored part of the Rapid RSI is just there as eye candy.
The easiest way to Size your positions is to keep your risk levels constant at whatever risk level your are comfortable with. I personally have found that using low risk at the beginning of the month with a scaled up approach as the account grows works well, but can hamper results if taken more than 2x beyond the original risk level.
So let's say you start with 1/2% risk at the beginning of the month, make several good trades so you have 5 winners, and 2.5% gain, you can choose to scale up to .75% or 1% risk/trade, but be careful that if you have a couple losers, to scale back to 1/2% to protect your original capital on your previous month's realized gains. These numbers are just a guide and an example... The position sizing is more complicated then this, so let me explain a little better with an example:
Let's say the market is sideways and volatile and meets your setup requirements. You could take a position with a stop loss @ 2x the ATR, If the ATR is 10 on the 5 min chart, place stop loss @ 20 pips, and size your positions so 20 pips is also equal to your risk% parameters.
20 pips is now your risk, your reward depends on where you exit... There are several strategies for this, innumerable in fact. Your job as a trader is to trade so that you are consistently making good returns on your risk.
One thing I have found is when the market pulls away from one band, it moves to the opposite band, so you could simply take profit there, for 1-2x your risk and a good degree of accuracy, or once it reaches the opposite band trail your stop loss by whatever seems reasonable (1.5x my stop loss seems to work well as an example) based on the market conditions and volatility. Trailing it by the opposite inside band seems to work well in trending/volatile conditions. The point of a trailing stop loss is maximize your gains while protecting realized gains, so you might choose to either trail it tight or loosen it up.
For example: If you are long and the market is reaching a key level, like an even number or a resistance level you could choose to tighten your trailing stop, or loosen it on the event that it breaks through that level.
keep an eye on support/resistance, trend lines, and I'm sure someone will find some use with pivot points, or some other way to filter out bad trades or add accuracy, it should make sense and not just end up making your system more complicated
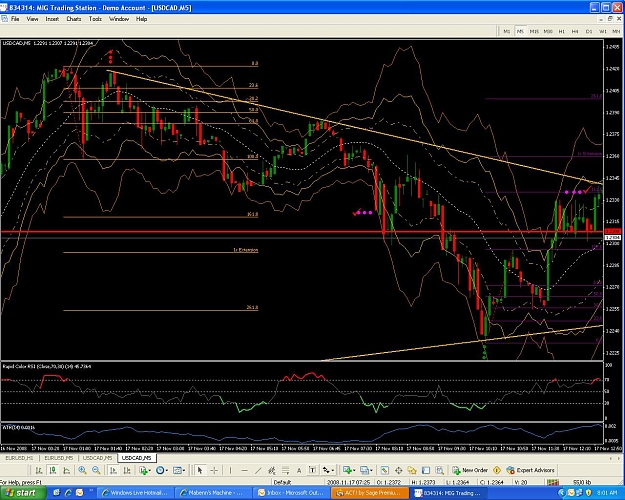
This is how I like my template to be set up because I see it as very simple, and it shows me area's that I need to sit up and take notice. All the stuff in the middle of the channels is of little importance to me unless the market is trending and pulling back... The 50, 100 and 200 SMA's are there for visual aide/confirmation of the trend.
When the market is Diverging from the RSI take notice. The idea is to look for low risk entries that have a good probability of an exit that allows for a positive expectancy. For example:
I ran a quick simulation in my excel sheet that I created using Van Tharp principles of trade tracking, position sizing, and System Quality Numbers... I will attach this when I get home tonight (I know someone will probably ask for it). This is from the book "The Definitive Guide to Position Sizing", -- Van Tharp
When I input a 50/50 win ratio with a 2-1 gain on the winners the system quality number was a whopping 7, Which is holy grail territory. I input a 50/50 win ratio with gains 1.25 x risk and the SQN was around 3.5, which is tradable and would consistently make money. So you don't necessarily need to capture the most of a move, you just need to have a good risk/reward ratio combined with a win ratio that creates positive results, whatever that may be and it will be different for every trader/trading style. I like going for 2x my risk because it gives me room to trail my stop if I think the market will keep going, it also gives me room to place my stop loss at BE when it get's close to my 2x exit area, or when I'm trying to protect capital and up by 1x my risk.
On another note, I have seen major players throwing 5+ million around call into our trading floor and as soon as they are 10 points in the good they put their stop loss at breakeven, that may or may not be a wise strategy but I will tell you that it greatly increases the likelyhood of being stopped out just because of the noise of the market, you might be very "right" about the trade but didn't give the market room to breathe in and out. Also most of the people that call in to our floor have no clue what they're doing with risk reward, position sizing, and they are just gambling... This is the conclusion I have made after watching many such traders go bust. You don't want to be like them. They are using huge leverage, so they must have a HIGH degree of accuracy which they don't, it's 50% at best... They consistently lose big and their emotions are a roller coaster, they don't have an edge.
Trade super small (1-1 leverage on your account is idea) until you have 20-40 trades, then analyze your trades. If things are working well, check yourself, then scale up a bit. Rinse, Repeate, Continue....
So I hope I have provided some with a very good way of approaching the markets while still keeping things simple.
I should mention (even though it seems to be common sense) I keep a sharp eye on the markets related to my target market, for the USD/CAD it's Oil, TSX, Dow, etc. Intermarket Analysis is excellent if you haven't found that out already. It makes sense that if Oil is tanking, the CAD should tank so the USD should go up. It makes sense that if the TSX is tanking, foreign investors are selling their canadian stocks and their canadian dollars, (unless they have a cad stock account). If the TSX is climbing, foreign investors will need to buy CAD Dollars to buy CAD stock... There's lot's of books in intermarket analysis.
Also I probably don't have to say this, but just in case - watch the news releases and use a live source (with no delay). For an example, if retail sales are coming out in the US and they are expected to be a certain number but come out much weaker than expected, bye bye to the Dollar... Especially if Oil and the TSX is climbing.
Knowing when to hold them and when to fold them is either an art or a science. You could simply place your exits at a predetermined level that gives a good expectancy, or hold your winners as long as possible, etc....
Any input would be greatly appreciated (that's why I'm posting this afterall...).
I will post charts to show you what my template looks like when I have a free minute or two. But you should be able to figure it out, or the template should work as is. I will try to avoid posting "well chosen" examples.
Also I have learned to keep track of every trade and every trading decision, and keep a Daily Journal. Perhaps I will begin posting my Daily Journal on this thread, but I don't think I will place my live trades on here because my system/approach might not be right for others, plus it will be delayed...
If you're not familiar with Van Tharp works, visit www.iitm.com and AT least get Trade Your Way to Financial Freedom, The Way of the Turtle by Curtis Faith, and I also highly reccomend The Peak Performance Course and System Development Courses.
Also please only constructive criticism. Thanks for any input and advice, and it will be interesting to see how others adapt this, hopefully it helps in some way.
I forgot to add, this is primarily used on the 5 and 15 min time frame. But I always keep an eye on the longer term, and use 1 minute for stalking a trade. Short term trading provides me with lot's of opportunity and helps me not get too bored... I am an "Adventurous Trader". You can go to www.tharptradertest.com and answer the questionairre - Very insightful!
****Trade this only during the most active times of your currency pair.****
Position sizing calculator is on post #22.
This trading theory is based on approaching the markets dynamically. Because the market dynamics are always changing, for example a simple 20 pip stop loss on the 5 min won't be the best thing all the time because the volatility changes. In the past month we have seen insane volatility, and I imagine people that were using a set stop loss have run into problems, It makes sense that they would.
I don't know If anyone could program anything from this template and approach.... Any ideas with that let me know!
So here goes:
I will try to spend as little time as possible on the entry techniques, and more on the position sizing and exit techniques, which are the only real way determine the outcome of your trade...
I have plotted 3 Keltner channels, All of them are plotted around a 20 period MA (invisible), with the first being drawn as a deviation envelope of 1.618, the second @2.618 and the 2rd @ 4.236, in accordance with Fibonacci fun.
It might work just as well to use a 2, 3, and 4 deviation but using magic numbers seems to envelope most of the price action and give the best zones to look for when placing trades. Plus... They're Magic Numbers, so it's almost as good as having a crystal ball on your desk.
Market's trade in these stages:
Up and Volatile,
Up and quiet
Sideways and Volatile
Sideways and quiet
Down and Volatile
Down and Quiet.
Knowing how to react in all situations is key, or knowing how your system reacts... but in the end, you are your system no?
The Rapid Colored RSI is there to look for covergence (confirming price action), and divergence patterns. If you don't know what that is there's a great page to study on how it can be usefull which includes several articles:
http://www.trading-naked.com/Divergence.htm
When the market is moving Up and Volatile , or down and volatile hopefully you have already received a signal or found a good place to go long/short and are still in your position but... Look for pullbacks into the zone between the white center mov avg (21 ema) and the gold dotted keltner channel. (or the 5ema - See Philip Nel's 5 min strategy)
When the market is up and quiet, or down and quiet the bands should be tighter, so you might look for pullbacks into the first set of bands opposite the trend direct, pullbacks into the 5/21 ema zone, or just pullbacks that are backed by support/resistance the key here being to follow the trend!!! Watch for OB/OS on the rapid RSI.
Sidways and Volatile, Look for pullbacks between the 1.618 and 4.236, with the best signals between the 2 outer bands for areas to go long/short. Confirm with RSI, either OB/OS or Divergence patterns. Trade the extremes of the sideways channel.
Sideways and quiet, look for pullbacks between the 2 innner bands (1.618 and 2.618) for areas to go long and short. Watch for OB/OS on the RSI.
The ATR is there to use for your stop loss, and for an eyeball measurment of volatility confirmation - See the Position sizing calculator on the next page for using the RSI as a stop loss measurement!
I have found that 2x the ATR can provide an excellent stop that isn't too far away to create good risk reward ratio's while still being outside of the noise of the market, which is 1xATR.
Note for mt4 programmers: I would rather have the ATR displayed on my chart screen like so: 1x ATR="", 2xATR ="" 3xATR="" etc. Instead of looking at the line and atr and multiplying it. If someone has the ability to program this that would be awesome to see and use!
RSI: If the rapid RSI is coverging (confirming) or diverging these are two things to watch for, it will always do both (duh)... Converging is confirming price actions, so if you are buying on a dip of a trend and RSI is confirming the price action, it's a safer spot - It is better if RSI is diverging on the dip, but you might have to zoom in to smaller time frames, for me that would be the 1 min chart.
So if it diverging from price in a sideways market, that could mean an excellent place to go long/short, if it is converging with a trend, that pullback is an excellent safe place to go long/short, if it is diverging in a trend, there will probably be 2-5 divergences before the trend does a major correction or changes. Sometimes there is excellent patterns when you see the first divergence, followed by a pullback with convergence. This also works for the second divergence/convergence patterns. If this is confusing read the trading Naked article. I think this is pretty self explanatory.
The colored part of the Rapid RSI is just there as eye candy.
The easiest way to Size your positions is to keep your risk levels constant at whatever risk level your are comfortable with. I personally have found that using low risk at the beginning of the month with a scaled up approach as the account grows works well, but can hamper results if taken more than 2x beyond the original risk level.
So let's say you start with 1/2% risk at the beginning of the month, make several good trades so you have 5 winners, and 2.5% gain, you can choose to scale up to .75% or 1% risk/trade, but be careful that if you have a couple losers, to scale back to 1/2% to protect your original capital on your previous month's realized gains. These numbers are just a guide and an example... The position sizing is more complicated then this, so let me explain a little better with an example:
Let's say the market is sideways and volatile and meets your setup requirements. You could take a position with a stop loss @ 2x the ATR, If the ATR is 10 on the 5 min chart, place stop loss @ 20 pips, and size your positions so 20 pips is also equal to your risk% parameters.
20 pips is now your risk, your reward depends on where you exit... There are several strategies for this, innumerable in fact. Your job as a trader is to trade so that you are consistently making good returns on your risk.
One thing I have found is when the market pulls away from one band, it moves to the opposite band, so you could simply take profit there, for 1-2x your risk and a good degree of accuracy, or once it reaches the opposite band trail your stop loss by whatever seems reasonable (1.5x my stop loss seems to work well as an example) based on the market conditions and volatility. Trailing it by the opposite inside band seems to work well in trending/volatile conditions. The point of a trailing stop loss is maximize your gains while protecting realized gains, so you might choose to either trail it tight or loosen it up.
For example: If you are long and the market is reaching a key level, like an even number or a resistance level you could choose to tighten your trailing stop, or loosen it on the event that it breaks through that level.
keep an eye on support/resistance, trend lines, and I'm sure someone will find some use with pivot points, or some other way to filter out bad trades or add accuracy, it should make sense and not just end up making your system more complicated
This is how I like my template to be set up because I see it as very simple, and it shows me area's that I need to sit up and take notice. All the stuff in the middle of the channels is of little importance to me unless the market is trending and pulling back... The 50, 100 and 200 SMA's are there for visual aide/confirmation of the trend.
When the market is Diverging from the RSI take notice. The idea is to look for low risk entries that have a good probability of an exit that allows for a positive expectancy. For example:
I ran a quick simulation in my excel sheet that I created using Van Tharp principles of trade tracking, position sizing, and System Quality Numbers... I will attach this when I get home tonight (I know someone will probably ask for it). This is from the book "The Definitive Guide to Position Sizing", -- Van Tharp
When I input a 50/50 win ratio with a 2-1 gain on the winners the system quality number was a whopping 7, Which is holy grail territory. I input a 50/50 win ratio with gains 1.25 x risk and the SQN was around 3.5, which is tradable and would consistently make money. So you don't necessarily need to capture the most of a move, you just need to have a good risk/reward ratio combined with a win ratio that creates positive results, whatever that may be and it will be different for every trader/trading style. I like going for 2x my risk because it gives me room to trail my stop if I think the market will keep going, it also gives me room to place my stop loss at BE when it get's close to my 2x exit area, or when I'm trying to protect capital and up by 1x my risk.
On another note, I have seen major players throwing 5+ million around call into our trading floor and as soon as they are 10 points in the good they put their stop loss at breakeven, that may or may not be a wise strategy but I will tell you that it greatly increases the likelyhood of being stopped out just because of the noise of the market, you might be very "right" about the trade but didn't give the market room to breathe in and out. Also most of the people that call in to our floor have no clue what they're doing with risk reward, position sizing, and they are just gambling... This is the conclusion I have made after watching many such traders go bust. You don't want to be like them. They are using huge leverage, so they must have a HIGH degree of accuracy which they don't, it's 50% at best... They consistently lose big and their emotions are a roller coaster, they don't have an edge.
Trade super small (1-1 leverage on your account is idea) until you have 20-40 trades, then analyze your trades. If things are working well, check yourself, then scale up a bit. Rinse, Repeate, Continue....
So I hope I have provided some with a very good way of approaching the markets while still keeping things simple.
I should mention (even though it seems to be common sense) I keep a sharp eye on the markets related to my target market, for the USD/CAD it's Oil, TSX, Dow, etc. Intermarket Analysis is excellent if you haven't found that out already. It makes sense that if Oil is tanking, the CAD should tank so the USD should go up. It makes sense that if the TSX is tanking, foreign investors are selling their canadian stocks and their canadian dollars, (unless they have a cad stock account). If the TSX is climbing, foreign investors will need to buy CAD Dollars to buy CAD stock... There's lot's of books in intermarket analysis.
Also I probably don't have to say this, but just in case - watch the news releases and use a live source (with no delay). For an example, if retail sales are coming out in the US and they are expected to be a certain number but come out much weaker than expected, bye bye to the Dollar... Especially if Oil and the TSX is climbing.
Knowing when to hold them and when to fold them is either an art or a science. You could simply place your exits at a predetermined level that gives a good expectancy, or hold your winners as long as possible, etc....
Any input would be greatly appreciated (that's why I'm posting this afterall...).
I will post charts to show you what my template looks like when I have a free minute or two. But you should be able to figure it out, or the template should work as is. I will try to avoid posting "well chosen" examples.
Also I have learned to keep track of every trade and every trading decision, and keep a Daily Journal. Perhaps I will begin posting my Daily Journal on this thread, but I don't think I will place my live trades on here because my system/approach might not be right for others, plus it will be delayed...
If you're not familiar with Van Tharp works, visit www.iitm.com and AT least get Trade Your Way to Financial Freedom, The Way of the Turtle by Curtis Faith, and I also highly reccomend The Peak Performance Course and System Development Courses.
Also please only constructive criticism. Thanks for any input and advice, and it will be interesting to see how others adapt this, hopefully it helps in some way.
I forgot to add, this is primarily used on the 5 and 15 min time frame. But I always keep an eye on the longer term, and use 1 minute for stalking a trade. Short term trading provides me with lot's of opportunity and helps me not get too bored... I am an "Adventurous Trader". You can go to www.tharptradertest.com and answer the questionairre - Very insightful!
****Trade this only during the most active times of your currency pair.****
Position sizing calculator is on post #22.
Attached File(s)
FX Specialist