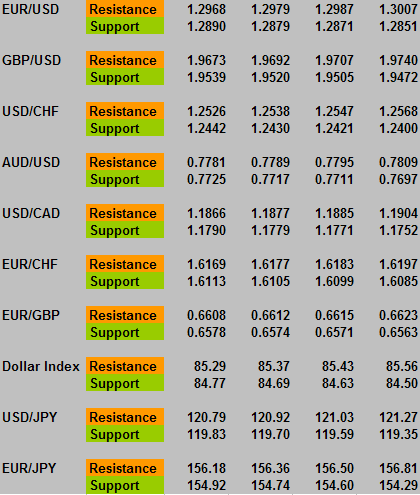
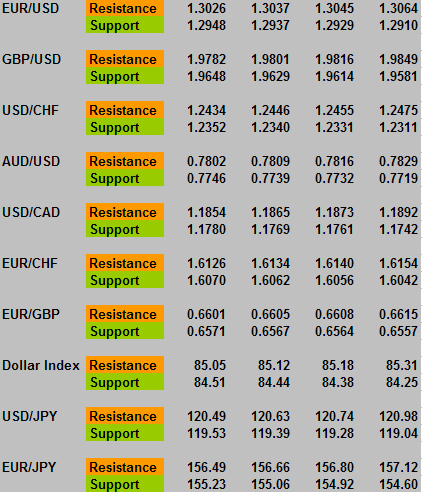
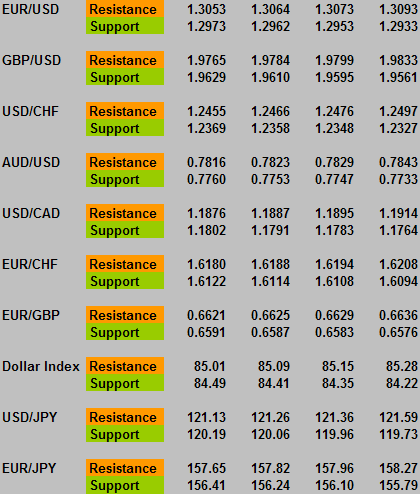
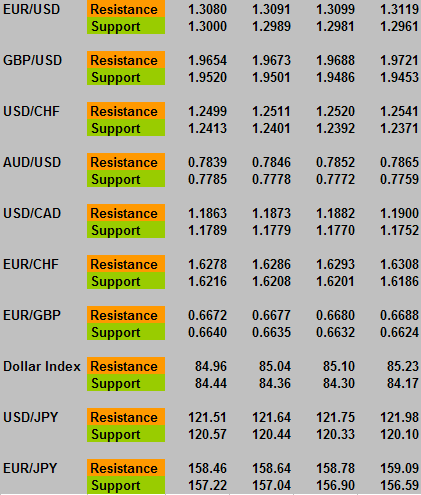
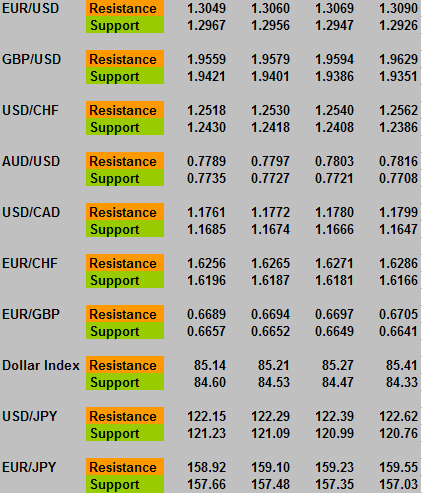
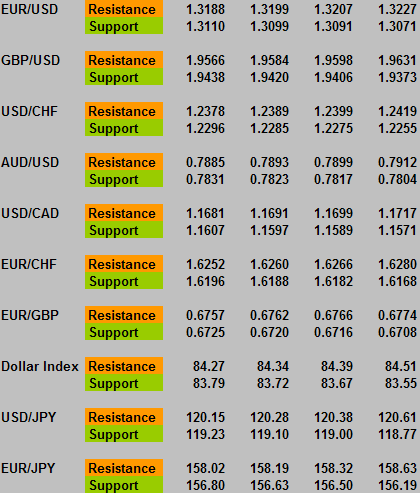
The levels below are valid through 2 PM PDT (22:00 GMT) on Tuesday - ideally, draw them on your charts so you can be aware of them. They are technical levels that I calculate (not fibs or pivots) that will identify areas that have a high probability of halting & reversing price action, or at the least slowing the velocity of the trend. I will post them here each day for the next couple of weeks.
Naturally, the STRL's do not work in isolation, they are best used in conjunction with other analysis techniques that help identifiy overbought/oversold conditions.
Regards,
Dave
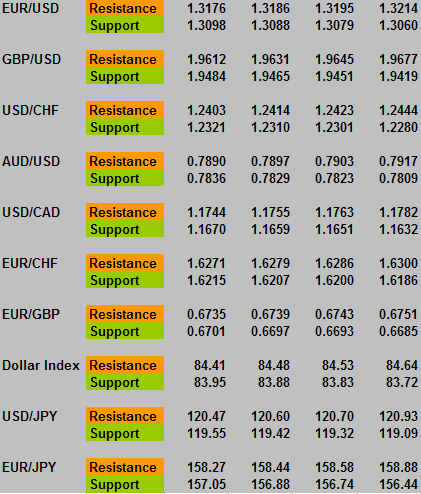
Naturally, the STRL's do not work in isolation, they are best used in conjunction with other analysis techniques that help identifiy overbought/oversold conditions.
Regards,
Dave
Attached Image