(Revise at 03-24-08)
Intro
This is the systematically strategy basically design for 4H chart. I personally don’t like to spend a lot of time to read the chart. I ever tried to use Day trading style and Week trading style, but I found out 4H trading style is the best.
I only read the chart twice a day, and the position usually take no more then a day to reach the target. Sometimes, I only read once a day at night, then I place the trade and go to sleep. From my trading experience, I had successfully double my live account twice by using this strategy at Sep-Dec, 2007. Because of switching to the other trading concept, I experiences badly draw down from Jan-Mar, 2008. As the result, I decided to focus at this successful trading strategy once again.
If you are still looking for new strategy or new knowledge to learn, I wish my information could be a part of your reference in your trading journey.
To know more about me, please visit my profile page for more detail.
Indicators
For the indicators, I use MACD 8/17/9 and Sto (Stochastic) 8/3/3 only.
The setup number was referring from the DiNapoli Indicator Setting.
Also, I plug in the Tom Demark Trend Line indicator to apply the trend line more easy.
Those indicator files will attach at the end of this thread.
Fibonacci Tools
1. What is SK? (Super Kluster)
SK is considering the price’s strong support or resistance level that formed from two different Fibonacci Retrace of 38.2 and 61.8 ratio.
SK only uses 38.2 and 61.8 ratio from the Fibonacci Retrace tool, and whenever two different Fibonacci Retrace ratios that cluster together with 38.2 and 61.8, it consider a strong support / resistance level. We call it SK (Super Kluseter) (1)
2. Target use
I use Fib Ext for my target reference, and they are fib ext 61.8/100/161.8
Risk Calculate Sheet
I will attach the spreads sheet I use when I calculate my risk / wining ratio at the end of this thread. The explanation of how to use it will explain later.
Setup
I will use up trend as the example when I explain the setup.
In downtrend, simply change the info reverse. (oversold to overbough....etc)
In Uptrend
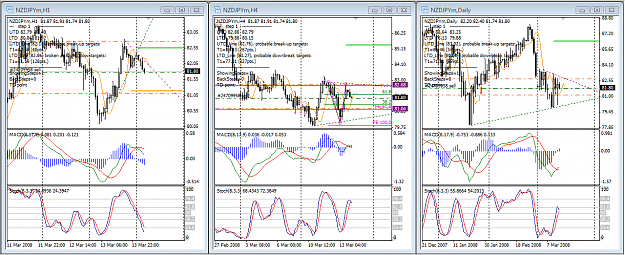
1. In UPtrend, look for 4H Sto oversold situation by scanning through all the pairs.
(Default Sto line is 76.4 / 23.6. If price reached consider a good setup qualification. Most of time, my sto will hit 0 / 100 line. )
2. Once 4H Sto oversold situation found, confirming that Day and H chart’s MACD direction are up. If Day or 4H MACD contain MACD Divergent, DO NOT TAKE THE TRADE.
(45 degree angle and parallel situation consider a good setup qualification.)
(If Day MACD stick together or cross down, there must be SK, 38.2, 61.8 AND Trendline hold the Price)
(If 4H Sto is only 50%-60% oversold situation, do not take the trade, b/c there might be a deeper retrace that might against your position.)
3. Confirm Day Trendline if it is holding the price as UPTREND.
(If price break, it must hold by SK or 38.2 / 61.8 fib ratio)
4. Draw the Fib retrace in 4H chart and find out is there SK exists.
5. If there is no SK, DO NOT TAKE THE TRADE.
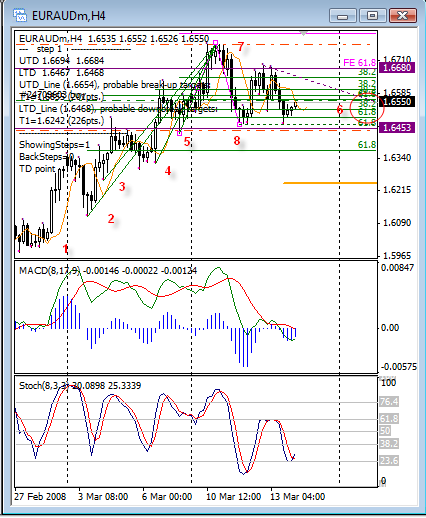
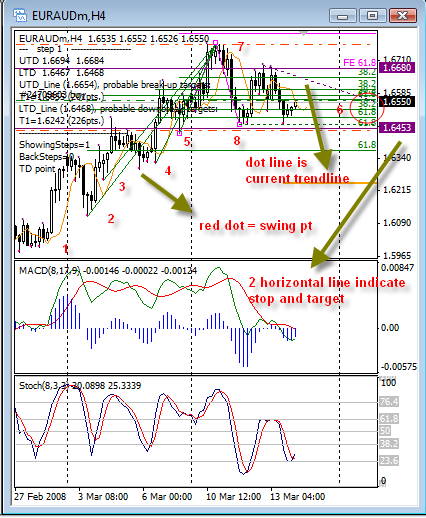
6. After confirming it is a good setup, draw the Fib ext from previous swing low to the current high, then to the current low to get the fib ext 61.8 ratio for the target price.
7. Before taking the trade, draw your stop out at current low or most closest 61.8 fib ratio. Then draw the target out at fib ext 61.8. Then, we will go to our risk control spread sheet.
Money Management
This session will explain how to use the spreads sheet.
I will use my current success trade, EURAUD, as the example along the explanation.
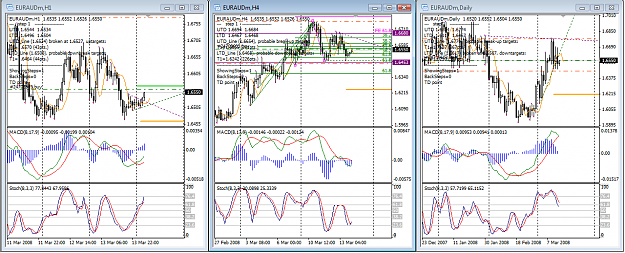
In the picture EURAUD, after we confirm the setup, stop and target, it is time for us to calculate our risk before we take the position.
If open at 16550 / stop 16453 / target 16680
Before we type in our number in the sheet, we have to do some default setting.
In the sheet, it includes all pairs that InterbankFX broker provides. Total are 19 pairs.
I already use default setting as trading in micro size acct, which contract is 100, leverage is 1:200, and all the spread in each pair, then divide by 100 from the regular pips value will gives you the value for micro pips value.
For example:
EURAUD spread is 7, 1k sizes is $1 per pip value. To calculate micro, take $1/100=$0.01. So, $0.01 is our micro pips value.
First, type in your account balance. Now, typing in the open / stop loss / target price into the sheet.
Second, you will get number shown in Profit and Loss. Retyping those number into the second Profit and Loss cell.
Third, you will get 0% shown in the Actual Risk from the bottom.
This mean to take this trade in micro size lot will only cost you 0% of your account balance. I do not suggest go larger then 5%-10%.
In the Max Lot, it tells you the largest lot number you can trade, then you can customize the number in the Lot cell.
For example:
I change Lot cell from 1 to 24, the actual risk I got is jump to 7%.
Forth, in the R/R, it automatically tells you that your risk and profit ratio is 1 : 1.34.
As the result, this is a very good trade after all.
Fifth, in the Long and Short cells, because it automatically adds the pairs’ spread into the original target and stop price in there, so it is helpful to use it in order to have more accurate stop and target in place.
Last thing I want to point out is below the EURUSD, you will see the total risk, total profit area. This area just simple add all your trade together and give you the total view of your risk, profit, ratio, and risk %. This only apply when you take trade in more then one pairs.
But Risk % is depends on your confident. Due to my account balance is small, I can accept less then 10% per trade, but if I take more then 3 pairs, it will cost me 30% from my acct. In this case, I still accept the risk. But one day, this risk will getting lower and lower once your balance growth.
P.S. Once the contract size change, remember to update margin, pip prices and pip value.
Rules and Condition
As a trader, we always need to prepare for the worst.
I list all the rules and condition from above information into the list for you to remember.
Rules
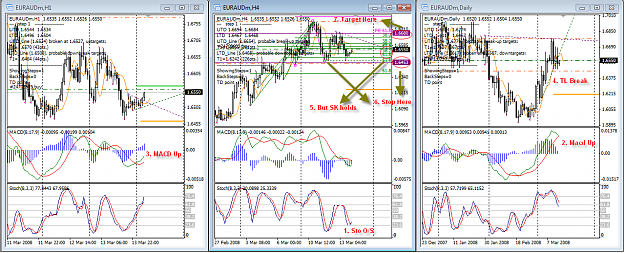
1. 4H Sto much in oversold(long) / overbought(short) condistion
2. MACD in both Day and H chart much in same direction. (long=up / short=down)
3. Do not trade if Day or 4H found MACD divergent.
4. Day Trendline must hold the price, and if price break, it must hold by SK or 38.2 / 61.8 fib ratio.
5. Price must not get close beyond 61.8 ratio.
6. Do not Risk more then 5%-10% from your account balance.
7. Try to keep your R/R ratio more then 1:1<
Condition
1. Close the trade if 4h oversold become overbought.
2. Close the trade if H/Day macd crossover.
3. Close the trade if trendline break.
4. Close the trade if it didn’t close after 8-16 hrs.
5. Close the trade if target almost reached or you had satisfied the result.
6. Close the trade if its almost reached weekend or Holiday.
--------------------------------------------------------------------------------------
Reference
(1) SK information, Neal Haught, DiNapoli.
--------------------------------------------------------------------------------------
ok, enough explanation.
Following pic will show you the setup by pictures.
I will post my recent trade very often.
Feel free to come back and check any update trading opportunity.
--------------------------------------------------------------------------------------
How do you like the system?
Kindly give me a vote at the up right hand corner said "Rate Thread"
--------------------------------------------------------------------------------------
Intro
This is the systematically strategy basically design for 4H chart. I personally don’t like to spend a lot of time to read the chart. I ever tried to use Day trading style and Week trading style, but I found out 4H trading style is the best.
I only read the chart twice a day, and the position usually take no more then a day to reach the target. Sometimes, I only read once a day at night, then I place the trade and go to sleep. From my trading experience, I had successfully double my live account twice by using this strategy at Sep-Dec, 2007. Because of switching to the other trading concept, I experiences badly draw down from Jan-Mar, 2008. As the result, I decided to focus at this successful trading strategy once again.
If you are still looking for new strategy or new knowledge to learn, I wish my information could be a part of your reference in your trading journey.
To know more about me, please visit my profile page for more detail.
Indicators
For the indicators, I use MACD 8/17/9 and Sto (Stochastic) 8/3/3 only.
The setup number was referring from the DiNapoli Indicator Setting.
Also, I plug in the Tom Demark Trend Line indicator to apply the trend line more easy.
Those indicator files will attach at the end of this thread.
Fibonacci Tools
1. What is SK? (Super Kluster)
SK is considering the price’s strong support or resistance level that formed from two different Fibonacci Retrace of 38.2 and 61.8 ratio.
SK only uses 38.2 and 61.8 ratio from the Fibonacci Retrace tool, and whenever two different Fibonacci Retrace ratios that cluster together with 38.2 and 61.8, it consider a strong support / resistance level. We call it SK (Super Kluseter) (1)
2. Target use
I use Fib Ext for my target reference, and they are fib ext 61.8/100/161.8
Risk Calculate Sheet
I will attach the spreads sheet I use when I calculate my risk / wining ratio at the end of this thread. The explanation of how to use it will explain later.
Setup
I will use up trend as the example when I explain the setup.
In downtrend, simply change the info reverse. (oversold to overbough....etc)
In Uptrend
1. In UPtrend, look for 4H Sto oversold situation by scanning through all the pairs.
(Default Sto line is 76.4 / 23.6. If price reached consider a good setup qualification. Most of time, my sto will hit 0 / 100 line. )
2. Once 4H Sto oversold situation found, confirming that Day and H chart’s MACD direction are up. If Day or 4H MACD contain MACD Divergent, DO NOT TAKE THE TRADE.
(45 degree angle and parallel situation consider a good setup qualification.)
(If Day MACD stick together or cross down, there must be SK, 38.2, 61.8 AND Trendline hold the Price)
(If 4H Sto is only 50%-60% oversold situation, do not take the trade, b/c there might be a deeper retrace that might against your position.)
3. Confirm Day Trendline if it is holding the price as UPTREND.
(If price break, it must hold by SK or 38.2 / 61.8 fib ratio)
4. Draw the Fib retrace in 4H chart and find out is there SK exists.
5. If there is no SK, DO NOT TAKE THE TRADE.
6. After confirming it is a good setup, draw the Fib ext from previous swing low to the current high, then to the current low to get the fib ext 61.8 ratio for the target price.
7. Before taking the trade, draw your stop out at current low or most closest 61.8 fib ratio. Then draw the target out at fib ext 61.8. Then, we will go to our risk control spread sheet.
Money Management
This session will explain how to use the spreads sheet.
I will use my current success trade, EURAUD, as the example along the explanation.
In the picture EURAUD, after we confirm the setup, stop and target, it is time for us to calculate our risk before we take the position.
If open at 16550 / stop 16453 / target 16680
Before we type in our number in the sheet, we have to do some default setting.
In the sheet, it includes all pairs that InterbankFX broker provides. Total are 19 pairs.
I already use default setting as trading in micro size acct, which contract is 100, leverage is 1:200, and all the spread in each pair, then divide by 100 from the regular pips value will gives you the value for micro pips value.
For example:
EURAUD spread is 7, 1k sizes is $1 per pip value. To calculate micro, take $1/100=$0.01. So, $0.01 is our micro pips value.
First, type in your account balance. Now, typing in the open / stop loss / target price into the sheet.
Second, you will get number shown in Profit and Loss. Retyping those number into the second Profit and Loss cell.
Third, you will get 0% shown in the Actual Risk from the bottom.
This mean to take this trade in micro size lot will only cost you 0% of your account balance. I do not suggest go larger then 5%-10%.
In the Max Lot, it tells you the largest lot number you can trade, then you can customize the number in the Lot cell.
For example:
I change Lot cell from 1 to 24, the actual risk I got is jump to 7%.
Forth, in the R/R, it automatically tells you that your risk and profit ratio is 1 : 1.34.
As the result, this is a very good trade after all.
Fifth, in the Long and Short cells, because it automatically adds the pairs’ spread into the original target and stop price in there, so it is helpful to use it in order to have more accurate stop and target in place.
Last thing I want to point out is below the EURUSD, you will see the total risk, total profit area. This area just simple add all your trade together and give you the total view of your risk, profit, ratio, and risk %. This only apply when you take trade in more then one pairs.
But Risk % is depends on your confident. Due to my account balance is small, I can accept less then 10% per trade, but if I take more then 3 pairs, it will cost me 30% from my acct. In this case, I still accept the risk. But one day, this risk will getting lower and lower once your balance growth.
P.S. Once the contract size change, remember to update margin, pip prices and pip value.
Rules and Condition
As a trader, we always need to prepare for the worst.
I list all the rules and condition from above information into the list for you to remember.
Rules
1. 4H Sto much in oversold(long) / overbought(short) condistion
2. MACD in both Day and H chart much in same direction. (long=up / short=down)
3. Do not trade if Day or 4H found MACD divergent.
4. Day Trendline must hold the price, and if price break, it must hold by SK or 38.2 / 61.8 fib ratio.
5. Price must not get close beyond 61.8 ratio.
6. Do not Risk more then 5%-10% from your account balance.
7. Try to keep your R/R ratio more then 1:1<
Condition
1. Close the trade if 4h oversold become overbought.
2. Close the trade if H/Day macd crossover.
3. Close the trade if trendline break.
4. Close the trade if it didn’t close after 8-16 hrs.
5. Close the trade if target almost reached or you had satisfied the result.
6. Close the trade if its almost reached weekend or Holiday.
--------------------------------------------------------------------------------------
Reference
(1) SK information, Neal Haught, DiNapoli.
--------------------------------------------------------------------------------------
ok, enough explanation.
Following pic will show you the setup by pictures.
I will post my recent trade very often.
Feel free to come back and check any update trading opportunity.
--------------------------------------------------------------------------------------
How do you like the system?
Kindly give me a vote at the up right hand corner said "Rate Thread"
--------------------------------------------------------------------------------------
Attached Image (click to enlarge)
Attached File(s)