In this presentation here, I will attempt to explain everything as thoroughly as possible and all questions will be answered with consideration.
As with any method that carries positive expectancy next to its title, you need unshakeable discipline to follow simple rules, apply common sense and employ a winning attitude to make it work for you.
This is an intraday trading method, that aims to capture substantial market movement with an excellent risk/reward while limiting the number of signals in a very clear cut way. Watching the charts all day is extremely boring, especially when we have no clue what is about to happen. The temptation to trade out of boredom is immense, "the market is running away, I don't want to miss the train", "I just missed a $XXXX move, next time it goes like that I'll find a reason to get in!". Those are just some of the things you'll be telling yourself while watching an intraday chart and the signals that you're looking for just aren't there, be warned.
In order to establish the fact that waiting for the absolutely best signal is of utmost importance and detrimental to your success, you may have to actually watch these charts, get bored, tell yourself the things mentioned above, enter trades recklessly, incur substantial losses to your account only to find out that waiting was totally in your own best interest.
********************************************************
The Charts:
We will be using a single timeframe, the 15M. The only time we will be looking at another timeframe is when we are drawing trendlines and identifying important levels in the market.
On your chart overlay the following:
150 EMA
50 SMA
CCI 50 + 14(See attachment)
The CCI is an indicator which many people do not like for some reason, its main purpose here is to boost your confidence and act as a great visual aid to gauge the momentum in the market. Credit is due to Dr Bob whom first described the use of the 50 CCI in a document available on a different website. For information about the CCI and what it does refer to
http://stockcharts.com/school/doku.p...nnel_index_cci
Please don't skip this link.
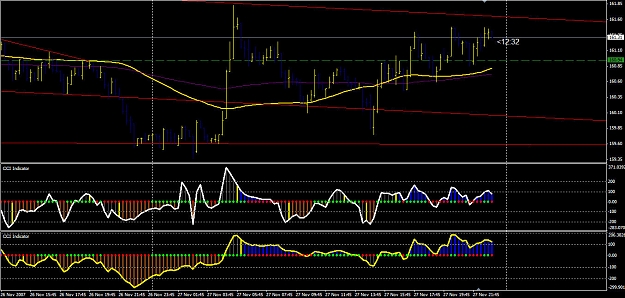
Your Chart should look like this:
Some key points:
* I use this strategy on Yen crosses such as Aud/Jpy, Eur/Jpy and Gbp/Jpy
These pairs provide fantastic volatility which when combined with these setups provide potentially very rewarding trades, risk/reward wise. It works on any volatile instrument.
EDIT: See post #97 for CCI indicator
-------------------------------------------------------------------------
More coming up in a flash.
As with any method that carries positive expectancy next to its title, you need unshakeable discipline to follow simple rules, apply common sense and employ a winning attitude to make it work for you.
This is an intraday trading method, that aims to capture substantial market movement with an excellent risk/reward while limiting the number of signals in a very clear cut way. Watching the charts all day is extremely boring, especially when we have no clue what is about to happen. The temptation to trade out of boredom is immense, "the market is running away, I don't want to miss the train", "I just missed a $XXXX move, next time it goes like that I'll find a reason to get in!". Those are just some of the things you'll be telling yourself while watching an intraday chart and the signals that you're looking for just aren't there, be warned.
In order to establish the fact that waiting for the absolutely best signal is of utmost importance and detrimental to your success, you may have to actually watch these charts, get bored, tell yourself the things mentioned above, enter trades recklessly, incur substantial losses to your account only to find out that waiting was totally in your own best interest.
********************************************************
The Charts:
We will be using a single timeframe, the 15M. The only time we will be looking at another timeframe is when we are drawing trendlines and identifying important levels in the market.
On your chart overlay the following:
150 EMA
50 SMA
CCI 50 + 14(See attachment)
The CCI is an indicator which many people do not like for some reason, its main purpose here is to boost your confidence and act as a great visual aid to gauge the momentum in the market. Credit is due to Dr Bob whom first described the use of the 50 CCI in a document available on a different website. For information about the CCI and what it does refer to
http://stockcharts.com/school/doku.p...nnel_index_cci
Please don't skip this link.
Your Chart should look like this:
Some key points:
* I use this strategy on Yen crosses such as Aud/Jpy, Eur/Jpy and Gbp/Jpy
These pairs provide fantastic volatility which when combined with these setups provide potentially very rewarding trades, risk/reward wise. It works on any volatile instrument.
EDIT: See post #97 for CCI indicator
-------------------------------------------------------------------------
More coming up in a flash.
Attached Image (click to enlarge)