NOTE THIS IS NOT FINANCIAL ADVICE NOR IT"S SIGNAL I LIKE TO EXPRESS MY KNOWLEDGE BECAUSE MORE YOU EXPRESS MORE IT GETS PERFECT SO DON'T BLINDLY DEPEND ON THIS ANALYSIS AND IT ALSO COULD BE WRONG IM NOT A MAGICIAN WHO TELLS WHERE GOLD MOVE;
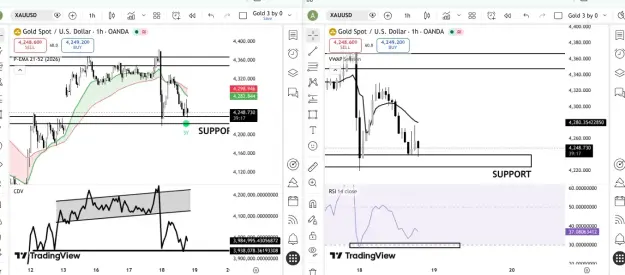
On the left chart is 1H GOLD in which 21 EMA is above price which indicates short term bearish but if you look a little down a bit and see that the CDV is making HH and HL while market is making LH and LL while the CDV was in a PARALLEL channel in which break of it CDV couldn't retest and start making LH and LL but it also failed to break below its support too, if it didn't break the THICK BLACK Line which I indicating now as a support.
THAT WAS LEFT CHART ANALYSIS NOW FOR RIGHT ONE AND IN THE END I'LL TELL MY VIEW;
Now if you look on the right chart which is 1H GOLD in which VWAP is indicating bearish and If you look closely at the RSI which is at value of 38 after bouncing back from 71 and is currently at It's support too...
Now after analysing the market I am got into this conclusion; but first of all today Gold has given the move it can now we have to stay out of market until tomorrow;
LEFT CHART BASES COMBINES WITH RIGHT SIDE:
More likely gold will be bullish tomorrow whether we keep the indicators a side simple price actions tells that gold will be bullish accordingly to the daily candles; Now look into indicators if price fails to break below support of CDV and then CDV closes above its previous high<high then as market is making LL,LH then hidden bullish divergence will be seen and if not so which is not likely to be; gold will fall to $4100-$3900 for sure.
Now combining with the right side in which is VWAP and RSI, look closely on the VWAP its bearish obviously but RSI is at It's support buyers will be If RSI respects its support like go below to value at 28 and then enter into value of 30-32 then buying will be again VWAP will be changed
THIS WAS ON INDICATORS;
IF YOU WANT PRICE ACTION TOO;
By analysing simple price action market is at It's support if it breaks below retest closes below 1H candle obviously $4100-$3900 will be the levels market will target and if not so closes above with all of the indicators indicating the signals I've mentioned then buying is the best option for tomorrow, whether you look at Daily Candle, Price action, or Indicators!
THANK YOU FOR READING MY ANALYSIS IF IT WAS HELPFUL GIVE A LIKE[ AGAIN NOT A FINANCIAL ADVICE TRADE AT YOUR OWN RISK ]
TOGETHER WE GROW!
AhmedFXB
Attached Image (click to enlarge)
2