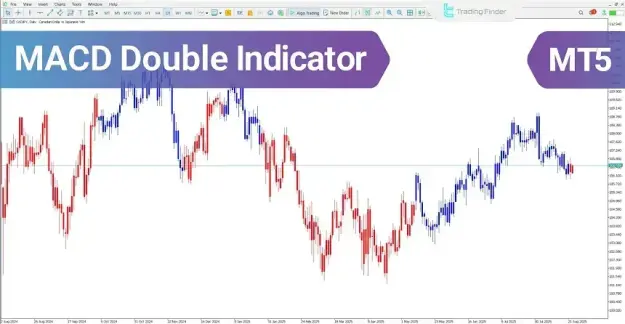


The indicator combines MACD calculations with additional trend filtering techniques to reduce false signals and provide clearer market analysis across different trading environments.
 You can download it from this link:
https://cdn.tradingfinder.com/file/5...5-by-tflab.zip
 You can also access the MetaTrader 4 version of this Indicator through this page:
https://www.cryptocraft.com/thread/1...-download-free
 For instructions on how to install:
https://www.forexfactory.com/thread/...-in-metatrader
Prop Firm DrawDown Protector : Prop Firm Capital Protection Expert MT5 |Forex Money Management: Forex Trade Management Expert MT5 | ICT Concepts Indicator MT5 |Smart Money Concepts Expert MT5 | Smart Money Trap Scanner | Get a free Expert Advisor license via Telegram and WhatsApp
Key Features of the MACD Double Indicator
- Multi-timeframe market analysis
- Buy and Sell signal generation
- Trend strength identification
- Candle color visualization
- Support for reversal and momentum trading
- Compatibility with Forex, cryptocurrency, stocks, and indices
How the MACD Double Indicator Generates Signals
The indicator generates trading signals based on:
- MACD crossover with the signal line
- MACD crossing above or below the zero level
- Momentum confirmation from higher timeframes
- Candle color transitions
When candle colors change from red to blue, the indicator signals the beginning of bullish momentum. This transition reflects increasing buyer strength and the possibility of a new upward trend.
Bullish Market Conditions
Bullish conditions generally include:
- MACD crossing above the signal line
- Positive movement above the zero level
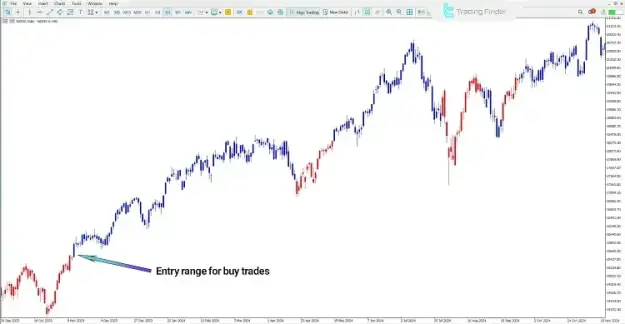
- Appearance of the first blue candle after bearish momentum
- Higher timeframe trend confirmation
Under bullish market conditions, blue candles dominate the chart structure and indicate strong buying pressure. Traders often consider the first blue candle as a potential Buy entry zone.
Typical bullish characteristics include:
- Strong upward momentum
- Consecutive blue candles
- Positive MACD histogram movement
- Formation of higher highs and higher lows
Bearish Market Conditions
Bearish market conditions appear when candle colors shift from blue to red. This color transition reflects increasing selling pressure and the possible beginning of a downward trend.
Bearish signal conditions include:
- MACD crossing below the signal line
- MACD moving beneath the zero level
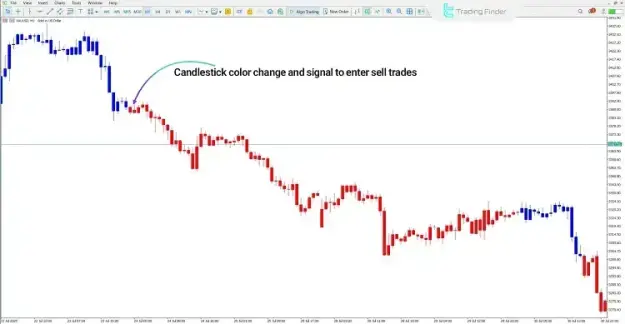
- Formation of the first red candle after bullish momentum
- Confirmation from higher timeframe bearish direction
In bearish scenarios, traders may use the first red candle as a suitable Sell entry opportunity.
MACD Double Indicator Settings
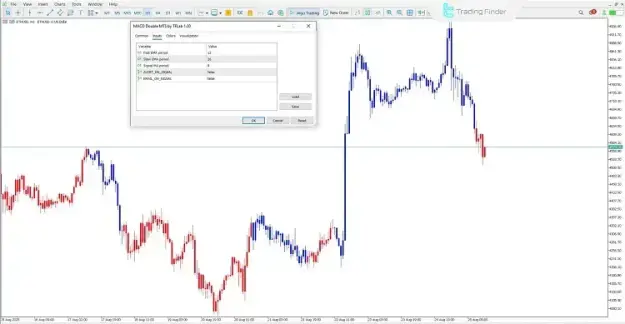
The MACD Double Indicator includes customizable parameters that allow traders to adjust the indicator according to different market conditions and trading strategies.
Important settings include:
- Fast EMA Period
- Defines the fast Exponential Moving Average calculation period
- Slow EMA Period
- Determines the slow Exponential Moving Average period
- Signal MA Period
- Specifies the signal moving average calculation period
- ALERT_ON_SIGNAL
- Enables trading signal alerts
- EMAIL_ON_SIGNAL
- Sends trading notifications through email
Advantages of the MACD Double Indicator
The MACD Double Indicator offers several advantages for technical traders:
- Improved trend filtering
- Enhanced signal accuracy
- Reduced false entries
- Clear visual market interpretation
- Effective momentum analysis
- Suitable for intraday and trend-following strategies
Conclusion
This indicator is widely used in Forex, cryptocurrency, stock, and index trading within the MetaTrader 5 environment. Blue candles represent bullish momentum, while red candles indicate bearish pressure. The transition between these colors helps traders identify possible market reversals and trend continuation opportunities more effectively.