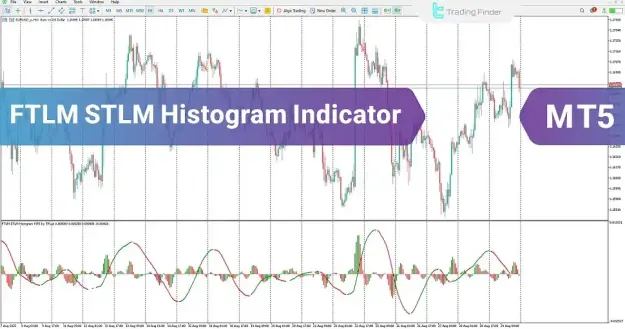
Through the integration of a momentum histogram and an oscillator line, this indicator enables traders to interpret market direction more effectively and refine entry timing with greater precision.
https://cdn.tradingfinder.com/file/5...5-by-tflab.zip
https://www.cryptocraft.com/thread/1...oad-free-tflab
https://www.forexfactory.com/thread/...-in-metatrader
Prop Firm DrawDown Protector : Prop Firm Capital Protection Expert MT5 |Forex Money Management: Forex Trade Management Expert MT5 | ICT Concepts Indicator MT5 |Smart Money Concepts Expert MT5 | Smart Money Trap Scanner | Get a free Expert Advisor license via Telegram and WhatsApp
Key Features and Specifications
- Category: Oscillator and Trading Assistance Tool
- Indicator Type: Trend-following and Lagging
- Timeframe: Multi-Timeframe compatibility
- Trading Styles:
- Intraday Trading
- Scalping
- Day Trading
- Supported Markets:
- Forex
- Cryptocurrencies
- Stocks
- Indices
Indicator Structure and Signal Logic
The FTLM STLM Histogram Indicator presents momentum dynamics through color-coded histogram bars combined with an oscillator line:
- Green Histogram and Line: Reflect increasing bullish momentum and upward price pressure
- Red Histogram and Line: Indicate strengthening bearish momentum and downward pressure
Signal Interpretation
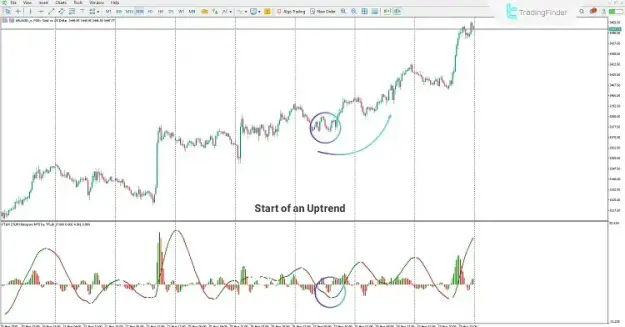
- A shift from red to green suggests that a bearish correction has ended and a bullish trend is resuming or forming
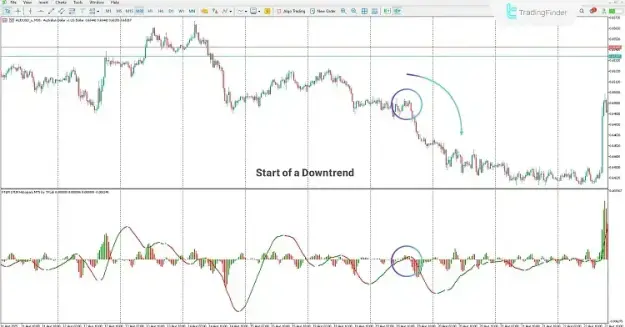
- A shift from green to red indicates that a bullish correction has concluded and a bearish trend is continuing
These transitions serve as confirmation signals, allowing traders to trade in alignment with the dominant trend rather than against it.
Trading Applications
Bullish Trend Scenario
During an uptrend, the indicator helps traders detect the completion of pullbacks and continuation of upward momentum:
- Histogram changes from red to green
- Oscillator confirms strengthening buying pressure
- Potential opportunity to enter buy trades in line with the main trend
This method supports more strategic entries following temporary retracements.
Bearish Trend Scenario
In a downtrend, the indicator assists in identifying the end of upward corrections:
- Histogram shifts from green to red
- Oscillator confirms increasing selling pressure
- Traders may consider sell positions aligned with the dominant trend
The magnitude of histogram bars also provides insight into the strength and intensity of the trend.
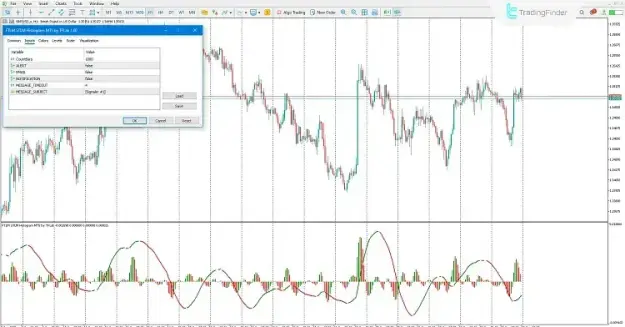
Indicator Settings
The FTLM STLM Histogram Indicator includes flexible configuration options for improved performance and usability:
- Count Bars: Determines the number of candles displayed in the histogram
- Alert System:
- Enable or disable visual alerts
- Email notifications for signal changes
- Mobile push notifications for real-time updates
- Message Timeout: Controls the interval between alert signals
- Message Subject: Customizes alert messages for easier identification
These adjustable parameters allow traders to tailor the indicator to their preferred trading style and strategy.
Conclusion
The FTLM STLM Histogram Indicator is a reliable and structured momentum analysis tool within the MetaTrader 5 environment. It provides a clear representation of trend direction and strength while identifying the completion of corrective phases.
By leveraging histogram color changes and oscillator confirmation, traders can enhance trade timing, improve decision-making, and maintain alignment with the primary market trend.