By using color transitions, the indicator signals changes between bullish and bearish conditions. These visual cues help traders recognize situations where the market exits a corrective phase and resumes the dominant trend direction.
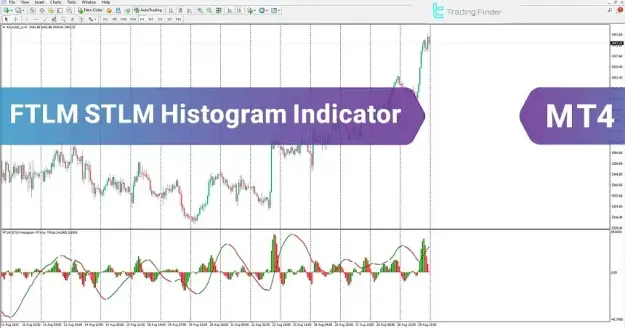
The FTLM STLM Histogram Indicator is specifically designed for use on the MetaTrader 4 (MT4) trading platform.
FTLM STLM Histogram Indicator Specifications
https://cdn.tradingfinder.com/file/5...4-by-tflab.zip
https://www.cryptocraft.com/thread/1...nloadfreetflab
https://www.forexfactory.com/thread/...-in-metatrader
Prop Firm DrawDown Protector : Prop Firm Capital Protection Expert MT4 | Forex Money Management: Forex Trade Management Expert MT4 |ICT Concepts Indicator MT4 | Smart Money Concepts Expert MT4| Smart Money Trap Scanner | Get a free Expert Advisor license via Telegram and WhatsApp
The FTLM STLM Histogram Indicator includes the following characteristics:
Indicator Categories
- Oscillators MT4 Indicators
- Currency Strength MT4 Indicators
- Trading Assist MT4 Indicators
Platform Compatibility
- MetaTrader 4 (MT4)
Required Trading Experience
- Elementary trading skills
Indicator Classification
- Trend Indicators
- Lagging Indicators
Supported Timeframes
- Multi-timeframe functionality
Suitable Trading Styles
- Day Trading
- Intraday Trading
- Scalping Strategies
Supported Trading Instruments
- Forex currency pairs
- Cryptocurrency markets
- Stock shares
- Global indices
Indicator Overview
The FTLM STLM Histogram Indicator for MT4 assists traders in detecting trend reversals and continuation signals based on the prevailing market direction.
When combined with traditional technical analysis, this indicator can help traders:
- Determine the dominant market trend
- Identify corrective price movements
- Anticipate the continuation of the primary trend
The indicator utilizes an oscillator line that changes color dynamically to represent market sentiment.
- When market conditions shift from bearish to bullish, the oscillator line changes from red to green.
- When conditions move from bullish to bearish, the oscillator line changes from green to red.
These visual signals allow traders to quickly interpret changes in momentum and market direction.
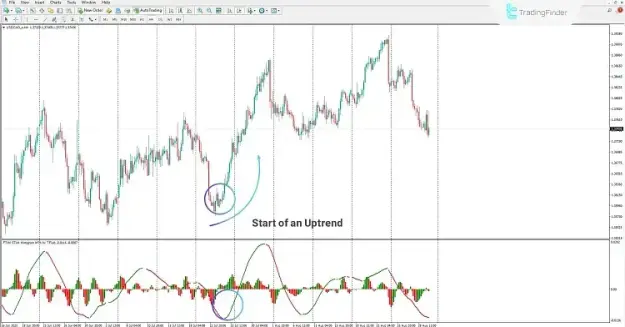
Bullish Market Scenario
During a bullish market trend, the FTLM STLM Histogram Indicator can help identify the end of a temporary correction and the potential continuation of the upward movement.
For example, when analyzing the 4-hour chart of the USDCAD currency pair, traders may observe the following conditions:
- The market maintains an overall uptrend
- Price enters a short-term corrective phase
- The histogram and oscillator reflect momentum changes
A potential buy signal may appear when:
- The histogram color changes
- The oscillator line shifts from red to green
This signal may indicate that the correction has ended and that the market is likely to continue moving in the direction of the primary bullish trend.
Key analytical observations include:
- Recognition of bullish trend continuation
- Identification of momentum changes within the histogram
- Confirmation of the transition from correction to trend movement
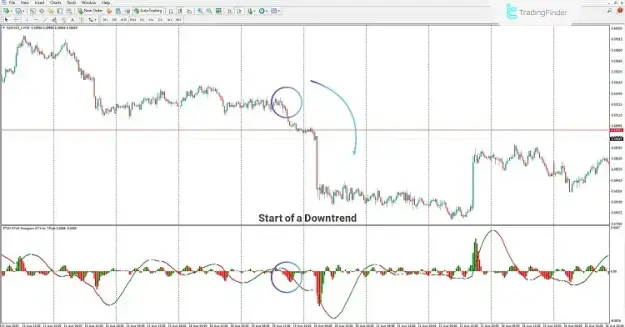
Bearish Market Scenario
In a bearish market trend, the FTLM STLM Histogram Indicator can help traders identify when a temporary upward correction ends and the downward trend resumes.
For example, when examining the 30-minute chart of the NZDUSD currency pair, traders may observe:
- The overall market trend is bearish
- Price experiences a temporary upward correction
- The oscillator line reflects shifts in market momentum
A potential sell signal may emerge when:
- The oscillator line changes from green to red
This signal may suggest that the correction has concluded and the market may continue moving in the main bearish direction.
Important analytical signals include:
- Confirmation of bearish trend continuation
- Detection of momentum reversal from correction to downtrend
- Identification of potential selling opportunities
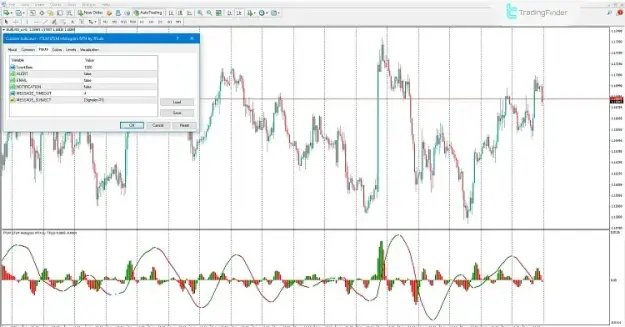
FTLM STLM Histogram Indicator Settings
The indicator provides several adjustable parameters that allow traders to tailor its functionality to their specific trading strategies.
Key configuration options include:
Count Bars
- Specifies the maximum number of candles displayed in the histogram window.
ALERT
- Enables or disables alerts when the oscillator detects a trend change.
- Allows the indicator to send notifications to an email address when signals occur.
NOTIFICATION
- Enables push notifications to mobile devices when the trend direction changes.
MESSAGE_TIMEOUT
- Defines the time interval between alert notifications.
MESSAGE_SUBJECT
- Allows customization of the alert message subject.
These settings make it possible to integrate the indicator into automated notification systems and structured trading workflows.
Conclusion
The FTLM STLM Histogram Indicator for MT4 is a practical technical analysis solution designed to help traders recognize trend momentum shifts and potential reversal points in financial markets.
By displaying information through a histogram window and a color-changing oscillator line, the indicator provides clear visual signals that highlight the transition between corrective movements and the dominant market trend.
Key advantages of the indicator include:
- Visual identification of trend reversals
- Recognition of corrective phases in price movements
- Confirmation of trend continuation signals
- Compatibility with multiple trading styles and financial instruments
When the oscillator changes from red to green, it signals a transition from bearish conditions to bullish momentum. Conversely, when the oscillator shifts from green to red, it may indicate the beginning of a bearish reversal.
These capabilities make the FTLM STLM Histogram Indicator a valuable component of a trader’s technical analysis toolkit on the MetaTrader 4 platform.