Unlike conventional moving averages, this indicator does more than display a single trend line. In addition to plotting a moving average line, it creates dynamic upper and lower bands around the average. These bands define the potential range of price movement and provide traders with deeper insight into market volatility and structure.
https://cdn.tradingfinder.com/file/5...5-by-tflab.zip
https://www.cryptocraft.com/thread/1...mt4-free-tflab
https://www.forexfactory.com/thread/...-in-metatrader
Prop Firm DrawDown Protector : Prop Firm Capital Protection Expert MT5 |Forex Money Management: Forex Trade Management Expert MT5 | ICT Concepts Indicator MT5 |Smart Money Concepts Expert MT5 | Smart Money Trap Scanner | Get a free Expert Advisor license via Telegram and WhatsApp
Specification of the Machine Learning Moving Average Indicator
The Machine Learning Moving Average Indicator is structured to support a wide range of trading strategies and financial markets.
Indicator Categories
- Signal & Forecast Indicators for MetaTrader 5
- Machine Learning Indicators for MetaTrader 5
- Moving Average Indicators for MetaTrader 5
Platform
- MetaTrader 5 Trading Platform
Trading Skill Level
- Elementary
Indicator Type
- Reversal Indicator
Timeframe Compatibility
- Multi-Timeframe Support
Trading Styles
- Swing Trading
- Scalping
- Day Trading
Supported Trading Instruments
- Forex Market
- Cryptocurrency Market
- Stock Market
- Commodities
- Market Indices
- Share Stocks
Machine Learning Moving Average Indicator at a Glance
Signal generation within the Machine Learning Moving Average indicator is primarily determined by the interaction between price action and the surrounding bands.
The indicator analyzes whether the price breaks beyond the statistical limits of the channel.
- When the price rises above the upper band, the indicator interprets this movement as increasing bullish momentum and generates a buy signal.
- When the price declines below the lower band, the indicator detects growing bearish pressure and produces a sell signal.
This approach enables traders to identify trend continuation opportunities as well as potential reversal areas with greater precision.
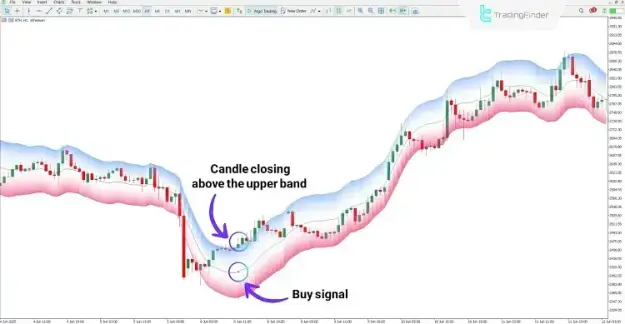
Buy Signal
On the Ethereum (ETH) chart in the 1-hour timeframe, the price moves above the upper band and the candle closes beyond this level.
Under these circumstances:
- The indicator identifies a breakout pattern.
- A blue marker appears on the chart.
- The signal indicates a potential buying opportunity.
Uptrend Analysis with the Machine Learning Moving Average Indicator
A breakout above the upper band typically suggests strengthening bullish momentum. Traders may use this signal to:
- Confirm the emergence of an upward trend
- Identify appropriate entry points for buy positions
- Combine the signal with additional technical analysis tools for confirmation
Identifying Entry Opportunities for Buy Trades
Potential entry opportunities often emerge after the breakout confirmation, particularly when:
- Price stabilizes above the upper band
- Momentum indicators support bullish market conditions
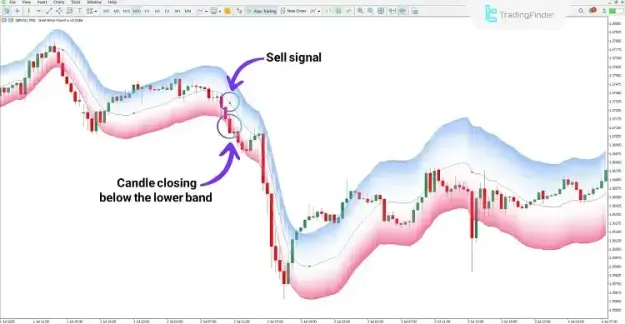
Sell Signal
On the **GBP/USD chart in the 30-minute timeframe, the indicator identifies a price movement below the lower band.
In this situation:
- The indicator detects increasing bearish pressure.
- A red marker appears on the chart.
- The signal suggests a potential selling opportunity.
Downtrend Analysis with the Machine Learning Moving Average Indicator
A breakout below the lower band usually reflects a strengthening downward trend.
This condition may help traders to:
- Confirm the formation of a bearish trend
- Detect continuation patterns during declining markets
- Improve risk management strategies for short positions
Identifying Reversal Zones
The lower band may also function as an important volatility boundary. Repeated interaction between price and this band can highlight:
- Potential market reversal zones
- Areas of significant bearish momentum
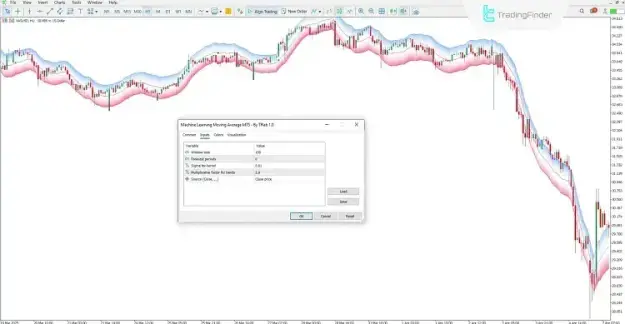
Settings of the Machine Learning Moving Average Indicator
The indicator includes several adjustable parameters that allow traders to modify its responsiveness and analytical depth according to their trading preferences.
Main Parameters
Window Size
- Determines the number of data points used in the moving average calculation.
Forecast
- Controls the predictive responsiveness of the indicator.
Sigma
- Represents the smoothing factor or statistical standard deviation applied to the price data.
Multiplicative Factor
- Regulates the expansion or contraction of the volatility bands.
Source
- Specifies the type of price data used as the input for the indicator.
Upperline
- Defines the upper boundary of the price fluctuation channel.
Lowerline
- Defines the lower boundary of the price fluctuation channel.
Conclusion
The Machine Learning Moving Average Indicator represents a modern development in algorithm-based technical market analysis. Through the integration of machine learning techniques and statistical modeling, the indicator effectively filters the primary market trend from unstable and unpredictable price movements.
Key benefits of this indicator include:
- Identification of the dominant market direction
- Detection of breakout-based trading signals
- Visualization of potential volatility ranges through upper and lower bands
By combining a trend-following moving average with dynamic volatility bands, this indicator provides traders with a structured framework for identifying trend continuation patterns, breakout opportunities, and potential reversal zones across multiple financial markets.