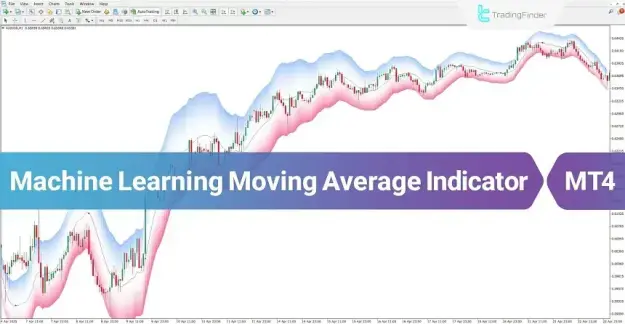
By filtering short-term volatility and market noise, the indicator highlights the underlying trend structure. This allows traders to observe market behavior more clearly and identify potential directional opportunities with improved precision.Alongside the moving average line, the indicator plots upper and lower bands that represent the probable range of price fluctuations. These dynamic boundaries help traders detect breakout zones, identify potential reversal areas, and evaluate shifts in market momentum.
https://cdn.tradingfinder.com/file/5...4-by-tflab.zip
https://www.cryptocraft.com/thread/1...mt5-free-tflab
https://www.forexfactory.com/thread/...-in-metatrader
Prop Firm DrawDown Protector : Prop Firm Capital Protection Expert MT4 | Forex Money Management: Forex Trade Management Expert MT4 |ICT Concepts Indicator MT4 | Smart Money Concepts Expert MT4| Smart Money Trap Scanner | Get a free Expert Advisor license via Telegram and WhatsApp
Specification of the Machine Learning Moving Average Indicator
The Machine Learning Moving Average MT4 indicator includes the following main specifications:
Indicator Categories
- Signal & Forecast MT4 Indicators
- Machine Learning Indicators for MetaTrader 4
- Moving Average MT4 Indicators
Platform
- MetaTrader 4 (MT4)
Required Trading Experience
- Suitable for traders with elementary trading knowledge
Indicator Type
- Reversal and trend detection indicator
Supported Timeframes
- Multi-Timeframe compatibility
Trading Styles
- Day Trading
- Scalping
- Swing Trading
Supported Markets
- Forex currency pairs
- Cryptocurrencies
- Stock markets
- Indices markets
- Commodity markets
- Share stocks
Machine Learning Moving Average Indicator Overview
The Machine Learning MA Indicator produces trading signals based on the interaction between price movement and the indicator bands.
The relative position of the price compared to the upper and lower bands is a key factor in determining potential market direction. When price moves beyond these bands, it often signals a shift in market momentum and may indicate the beginning of a new trend.
The primary signal principles include:
- Bullish Signal:
Occurs when the price breaks above the upper band. - Bearish Signal:
Occurs when the price falls below the lower band.
This analytical structure allows traders to recognize possible trend continuation patterns and reversal zones within the market.
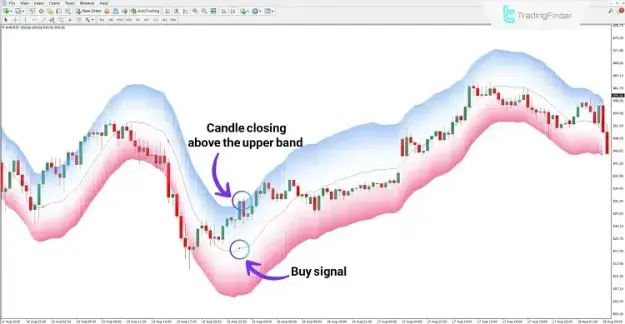
Buy Signal
A buy signal appears when the price breaks above the upper band and the candle closes outside this boundary.
For example, on the Binance Coin (BNB) chart in the 30-minute timeframe, the price moves above the upper band and confirms the breakout with a completed candle close. The indicator identifies this event and marks the signal with a blue indicator marker, suggesting a potential bullish trading opportunity.
This signal reflects increasing buying pressure and indicates the possibility of continued upward movement.
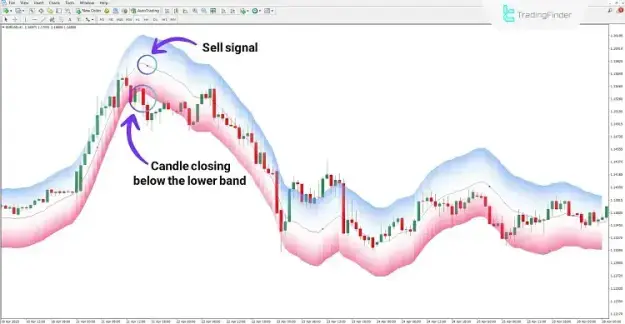
Sell Signal
A sell signal occurs when the price moves below the lower band, indicating potential bearish momentum in the market.
For instance, on the EUR/USD chart in the 1-hour timeframe, the price drops beneath the lower band. The indicator detects this movement and displays a red marker, confirming the appearance of a sell signal.
Such signals often reflect increasing selling pressure and may suggest the continuation of a downward trend.
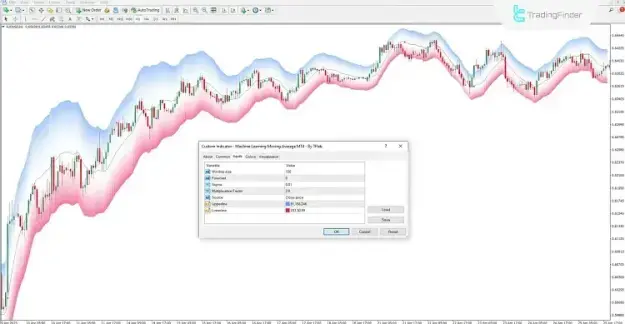
Machine Learning Moving Average Indicator Settings
The indicator provides several configurable parameters that allow traders to modify its behavior and sensitivity according to their trading strategy.
Key adjustable settings include:
- Window Size
- Determines the number of data points used for calculating the moving average.
- Forecast
- Controls the prediction intensity and responsiveness of the indicator.
- Sigma
- Defines the smoothing level or statistical deviation used in calculations.
- Multiplicative Factor
- Adjusts the expansion coefficient of the upper and lower bands.
- Source
- Specifies the input data type used for calculations, such as closing price or other price values.
- Upperline
- Represents the upper boundary of the expected price fluctuation range.
- Lowerline
- Defines the lower boundary of the projected price movement range.
- Defines the lower boundary of the projected price movement range.
Conclusion
The Machine Learning Moving Average Indicator for MT4 serves as a powerful analytical tool for traders seeking to identify market trends while minimizing the influence of short-term price noise.
By combining statistical techniques with machine learning-based analysis, this indicator provides a clearer representation of market structure and improves the reliability of trading signals.
Through the visualization of dynamic upper and lower bands, traders can estimate potential price movement ranges, identify breakout opportunities, and recognize possible reversal zones. This makes the indicator a practical and versatile solution for traders operating across multiple financial markets and trading strategies.