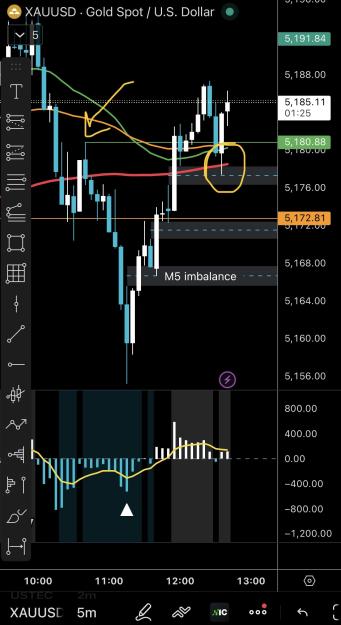
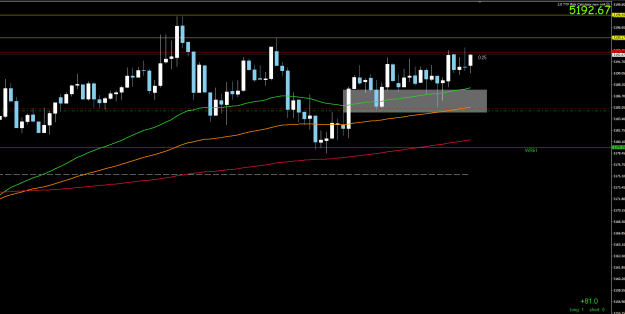
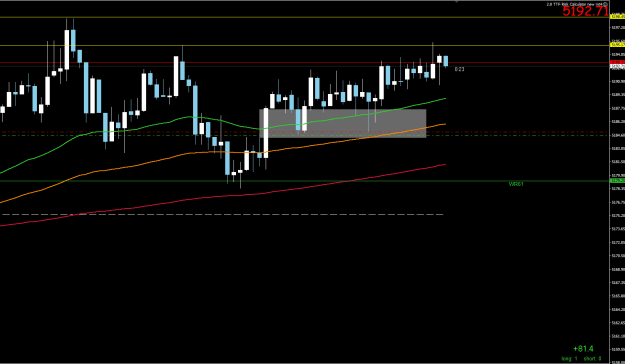
DislikedThe second,My SL was alwsays been swept . Update:the thrid, the same. {image}Ignored
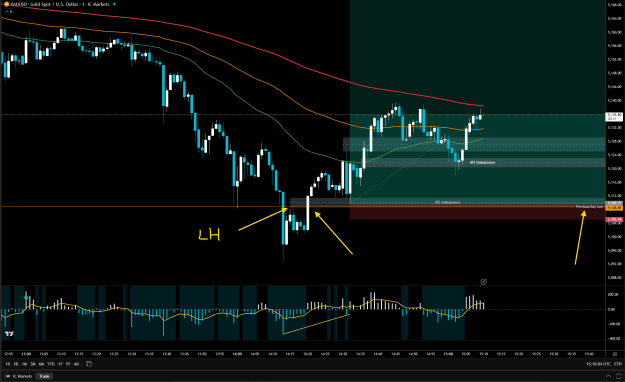
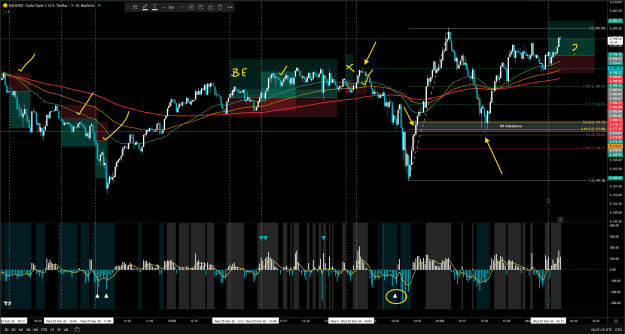
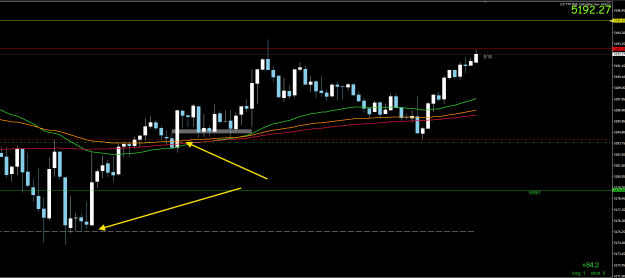
Can you see how the volume bars down are more explosive? - this is usually to fake you out unless structure has been broken.
In your chart, you can see the green line I marked, that is where you'd be wanting price to break to stay bearish.
After that was another higher low that you needed to see break before entering into any nova trades.
As you can see each time price came down and arrived there it respected that low and also you were spiked out because liquidity was resting above that high where your stop was and then you became the liqudity too. That's often why people wonder why they are stopped out and price runs off lol.
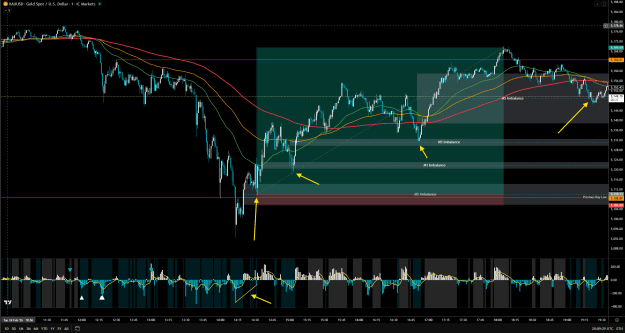
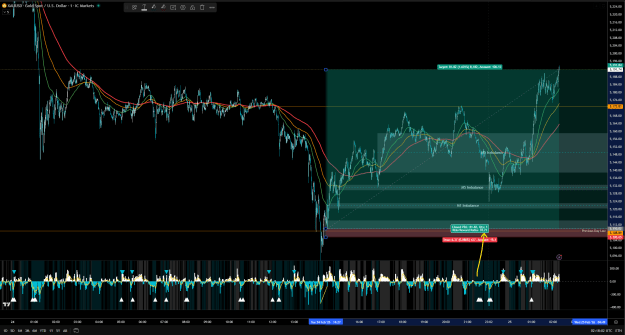
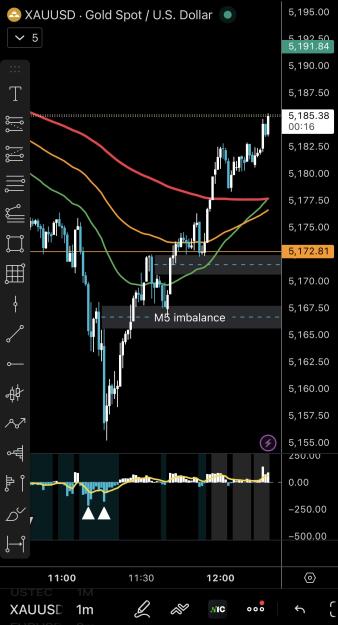
You have the indicator showing the min and major pivots (dots) so that will help you mark out where price needs to break and then you can switch to Nova once that happens.
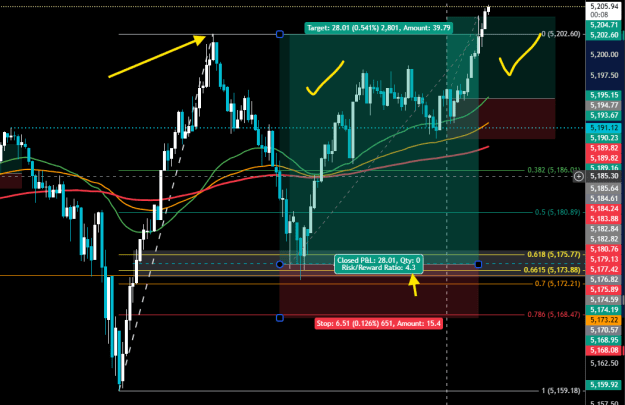
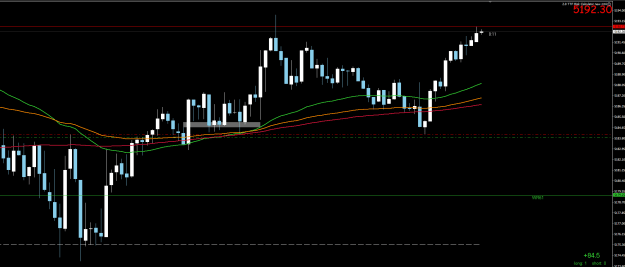
Attached Image (click to enlarge)
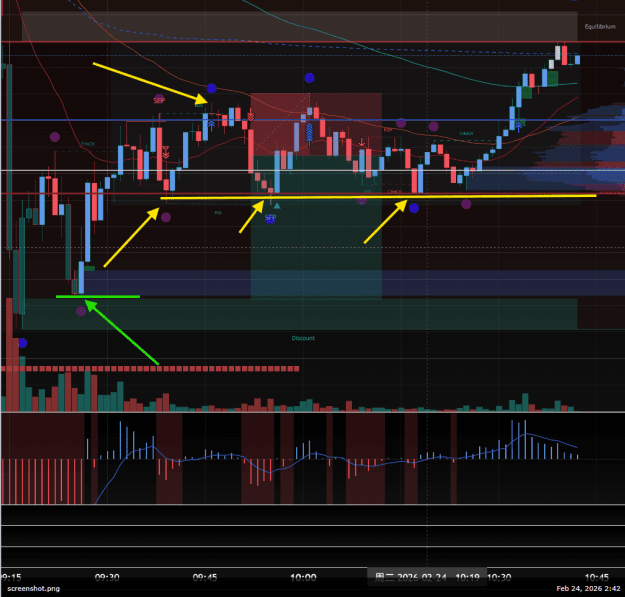
I would also say, I'm not sure if you trade from that chart but try and get your chart as clean as possible. Because theres way too much going on to trade profitably on there... seriously.
What I tend to do is turn on whatever I use... mark the areas and then turn them back off. It helps for clarity.
You can lead a horse to water, but you can't make it drink
1