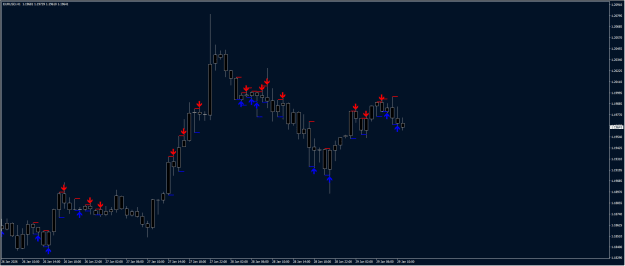
DislikedFound this CRT indicator, but nothing shows up on a chart. Is there something that needs to be changed or updated with it? It's supposed to mark the candle high and low, and when the next candle sweeps liquidity and closes back inside the previous candle range, an alert is sent, and an arrow is printed. {file}Ignored
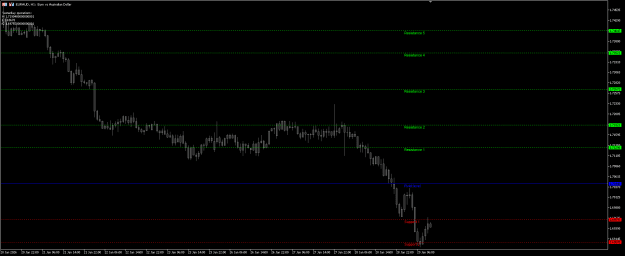
The idea is to plot a High line and a Low line from Bar[2] (second closed Bar) on the current timeframe.
Also with the option to use a session filter from a start hour to an end hour.
So, what you should see is two horizontal trend lines, always starting at Bar[2] of the current timeframe.
Basically, only the author knows why and how to use this.
BTW, a very good direction, but the application is bad...
It's not about Bar[2] or any other number.
It's about the historical Bar[n] which fits best - and that can't be fixed...
We can see that, but we can't quantise it...
.ex4/.ex5 files can't be fixed or modified / I'm not a coder!