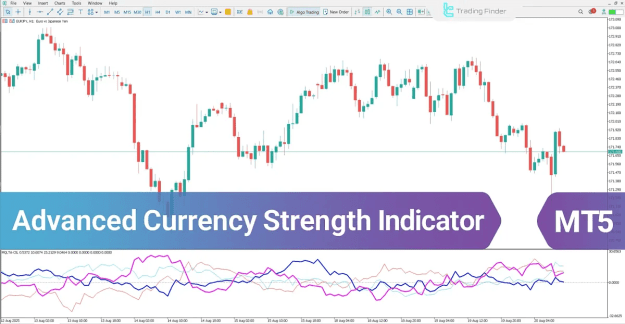
Each currency is plotted as an individual colored line inside an oscillator panel. For example, the USD may appear as a blue line, while the EUR is shown in red, allowing traders to visually track currency performance with clarity and precision.
An upward-sloping line reflects increasing demand and bullish pressure, whereas a downward-sloping line signals weakness and rising selling pressure.
https://cdn.tradingfinder.com/file/5...5-by-tflab.zip
https://www.cryptocraft.com/thread/1...tatrader-4-mt4
https://www.forexfactory.com/thread/...-in-metatrader
Prop Firm DrawDown Protector : Prop Firm Capital Protection Expert MT5 |Forex Money Management: Forex Trade Management Expert MT5 | ICT Concepts Indicator MT5 |Smart Money Concepts Expert MT5 | Smart Money Trap Scanner | Get a free Expert Advisor license via Telegram and WhatsApp
Advanced Currency Strength Indicator Specifications
Below are the core characteristics of the Advanced Currency Strength Indicator:
Indicator Classification
- Oscillator Indicator for MT5
- Currency Strength Analysis Tool
- Trading Assistance Indicator
Platform Support
- MetaTrader 5 (MT5)
Recommended Skill Level
- Intermediate traders
Indicator Function
- Trend Breakout Detection
- Trend Reversal Identification
Timeframe Compatibility
- Multi-Timeframe Support
Trading Approach
- Intraday Trading Strategies
Applicable Market
- Forex
How the Advanced Currency Strength Indicator Works
The indicator evaluates price data from several currency pairs and converts this information into relative strength values, which are displayed as colored lines in a single oscillator window.
Key interpretations include:
- Rising lines → strengthening currency and increasing buying interest
- Falling lines → weakening currency and growing selling pressure
- Line crossovers → changes in market dominance and possible trend shifts
These signals enable traders to align trades with the strongest currencies while avoiding weaker ones.
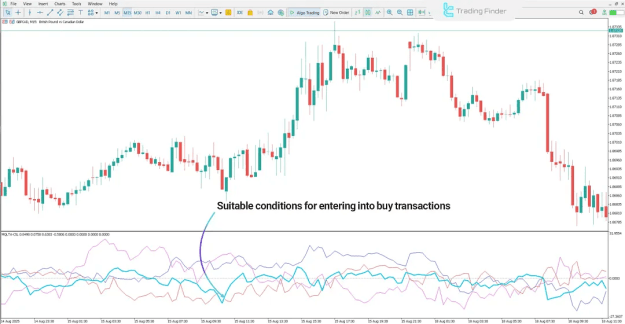
Bullish Market Scenario
In the example below, the GBP/CAD pair is observed on a 15-minute chart. As demand for the British Pound increases, the GBP line crosses above and remains above the CAD line, confirming a bullish structure.
This setup indicates:
- Strong institutional demand for GBP
- Declining strength in CAD
- Favorable conditions for long (buy) positions
Such alignments often mark high-probability bullish entry zones.
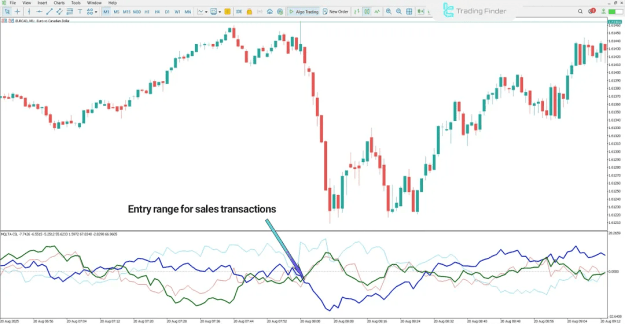
Bearish Market Scenario
The following chart displays EUR/CAD on a 1-minute timeframe. When the Euro loses strength against the Canadian Dollar, the EUR line drops below the CAD line, signaling the beginning of a bearish trend.
This condition reflects:
- Strong selling pressure on EUR
- Relative strength in CAD
- Market supply dominance
In this context, the indicator highlights sell opportunities with increased downside potential.
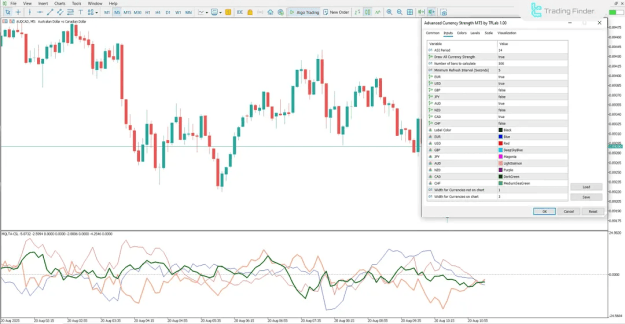
Advanced Currency Strength Indicator Settings (MT5)
The indicator includes a wide range of customization options in MetaTrader 5:
Calculation Settings
- RSIPeriod – Determines the RSI calculation length
- DrawAllCurrencies – Displays all available currencies
- MaxBars – Limits the number of candles analyzed
- MinimumRefreshInterval – Controls update frequency
Currency Selection Options
- UseEUR, UseUSD, UseGBP, UseJPY
- UseAUD, UseNZD, UseCAD, UseCHF
Visual Customization
- LabelColor – Color of currency labels
- Currency Colors – Individual color settings for each currency
- NormalWidth – Default line thickness
- SelectedWidth – Emphasized line thickness
Final Thoughts
The Advanced Currency Strength Indicator is a valuable Forex trading tool that transforms complex multi-pair data into an easy-to-read visual format.
- Strengthening currencies are shown with rising lines
- Weakening currencies appear as falling lines
- Crossovers reveal momentum shifts and trend transitions
By combining multi-timeframe analysis, customizable visuals, and clear strength signals, this indicator helps traders improve trend identification, trade timing, and overall decision-making in the Forex market.