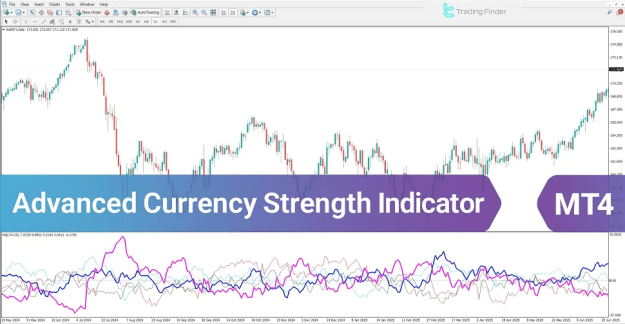
In this analytical model, distinct lines represent individual currencies; for instance, a blue line may designate the USD, while a red line designates the EUR.
Functionally, an ascending trajectory of a line signifies accumulating currency strength and demand pressure, whereas a descending trajectory denotes a depreciation or weakening of the specific currency.
https://cdn.tradingfinder.com/file/5...4-by-tflab.zip
https://www.cryptocraft.com/thread/1...tatrader-5-mt5
https://www.forexfactory.com/thread/...-in-metatrader
Prop Firm DrawDown Protector : Prop Firm Capital Protection Expert MT4 | Forex Money Management: Forex Trade Management Expert MT4 |ICT Concepts Indicator MT4 | Smart Money Concepts Expert MT4| Smart Money Trap Scanner | Get a free Expert Advisor license via Telegram and WhatsApp
Advanced Currency Strength Indicator Table
The following specifications outline the technical attributes and functional categories of the Advanced Currency Strength Indicator:
- Indicator Categories: Oscillators, Currency Strength, and Trading Assist Indicators for MT4.
- Platform Compatibility: MetaTrader 4 (MT4).
- Required Skill Level: Intermediate.
- Indicator Classification: Breakout and Reversal Indicators.
- Timeframe Capability: Multi-Timeframe functionality.
- Trading Styles: Intraday Trading.
- Tradable Instruments: Forex Markets.
Advanced Currency Strength Indicator at a Glance
The Advanced Currency Strength Indicator juxtaposes the real-time performance of multiple currency pairs, rendering the relative strength of each asset via color-coded oscillating lines.
- Bullish Momentum: An upward line movement indicates growing market demand and buying pressure.
- Bearish Momentum: A downward line movement reflects increasing supply and selling pressure.
Within this trading tool, line crossovers represent a critical shift in the balance of power between currencies. These intersections are interpreted as high-probability signals for the initiation of a new market trend.
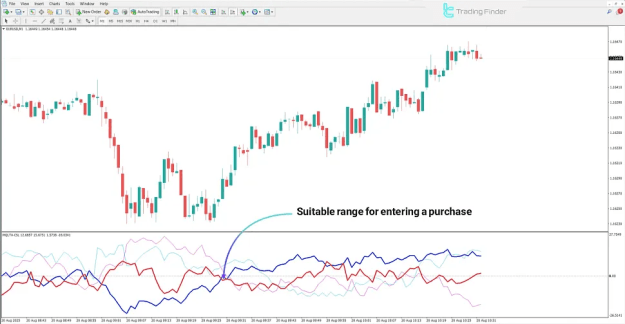
Indicator in an Uptrend
An analysis of the EUR/USD pair on a 1-minute timeframe illustrates the mechanics of a bullish signal. As the Euro strengthens against the Dollar, the indicator projects the EUR line above the USD line, confirming the onset of an uptrend.
This configuration signifies dominant buying pressure on the Euro and a relative weakening of the Dollar. Under these conditions, a buy signal is generated, suggesting a high probability of continued price appreciation.
- Uptrend analysis: Assessing bullish momentum via the Advanced Currency Strength Indicator.
- Visual Confirmation: Observing the start of an uptrend in MetaTrader 4.
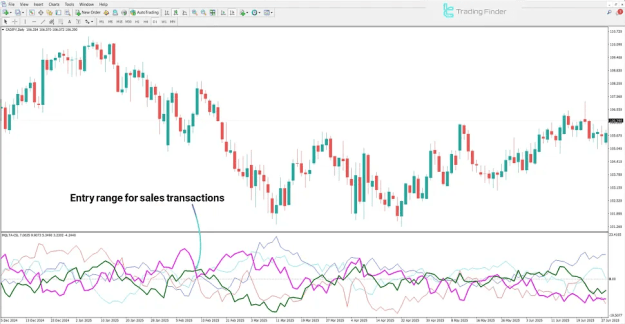
Indicator in a Downtrend
In the context of the CAD/JPY pair on a daily timeframe, a downtrend is established when the indicator highlights a depreciation of the CAD alongside a strengthening of the JPY.
This structural shift indicates elevated selling pressure on the Canadian Dollar relative to the Japanese Yen. Consequently, a sell signal is issued, increasing the likelihood of further price decline in the subsequent sessions.
- Downtrend analysis: Evaluating bearish momentum via the Advanced Currency Strength Indicator.
- Entry Zones: Identifying sell trade opportunities during a downtrend.
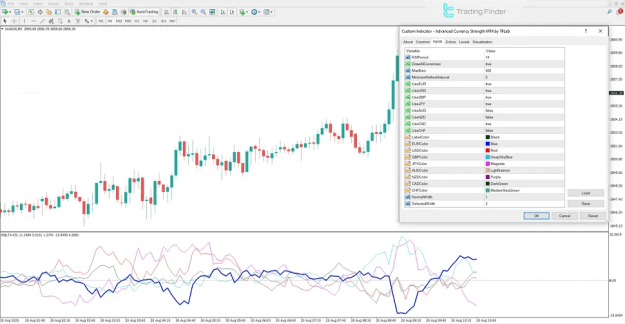
Advanced Currency Strength Indicator Settings
To customize the indicator for specific trading strategies, the Advanced Currency Strength Indicator offers the following adjustable parameters:
- RSIPeriod: Defines the period for the Relative Strength Index calculation.
- DrawAllCurrencies: Toggles the display of all available currencies on the panel.
- MaxBars: Sets the maximum number of historical candles used for calculation.
- MinimumRefreshInterval: Sets the minimum time interval for data refreshing.
- Currency Toggles: Options to Enable/Disable specific currencies (UseEUR, UseUSD, UseGBP, UseJPY, UseAUD, UseNZD, UseCAD, UseCHF).
- Visual Customization: Settings for LabelColor and specific line colors (e.g., EURColor, USDColor, GBPColor).
- Line Thickness: Adjustments for NormalWidth and SelectedWidth to enhance visual clarity.
Conclusion
The Advanced Currency Strength Indicator serves as an essential mechanism for quantifying the relative strength and weakness of global currencies, offering a clear visual representation of market conditions through dynamic colored lines.
- Upward Movement: Signals increasing demand and buying pressure.
- Downward Movement: Signals weakening momentum and selling pressure.
Furthermore, line crossovers provide critical data points regarding shifts in the currency power balance, effectively highlighting potential entry and exit points for traders.