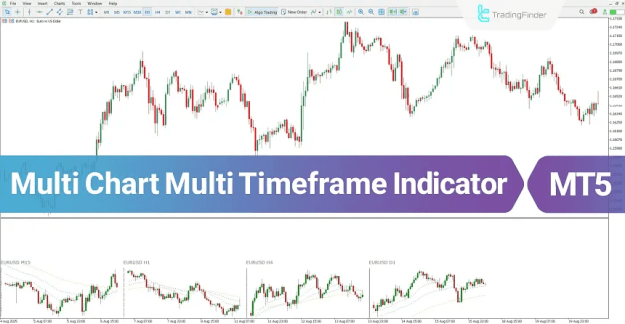
By presenting mini price charts, moving averages, and essential analytical filters in a separate display window, this indicator allows traders to observe both higher-timeframe market structure and lower-timeframe price behavior without the need for constant chart switching.
https://cdn.tradingfinder.com/file/6...5-by-tflab.zip
https://www.cryptocraft.com/thread/1...r-metatrader-4
https://www.forexfactory.com/thread/...-in-metatrader
Prop Firm DrawDown Protector : Prop Firm Capital Protection Expert MT5 |Forex Money Management: Forex Trade Management Expert MT5 | ICT Concepts Indicator MT5 |Smart Money Concepts Expert MT5 | Smart Money Trap Scanner | Get a free Expert Advisor license via Telegram and WhatsApp
Multi Chart Multi Timeframe Indicator Overview
The Multi Timeframe Multi Chart Indicator significantly improves analytical accuracy by synchronizing price movements across different timeframes. This layered approach to analysis strengthens trend confirmation and assists traders in recognizing potential trend reversals, consolidations, or corrective phases at an early stage.
Key advantages include:
- Simultaneous monitoring of multiple timeframes
- Clear visualization of trend alignment and divergence
- Reduced chart congestion and enhanced analytical efficiency
- Effective for both trend-following and reversal-based strategies
Indicator Categories and Trading Compatibility
Indicator Classification
- Trading Assist MT5 Indicators
- Moving Average MT5 Indicators
Supported Platform
- MetaTrader 5 (MT5)
Required Trading Skill Level
- Intermediate
Indicator Characteristics
- Non-Repaint MT5 Indicator
- Reversal Detection Indicator
Timeframe Coverage
- Multi-Timeframe Analysis
Supported Trading Styles
- Scalping
- Day Trading
- Swing Trading
Applicable Financial Markets
- Forex
- Cryptocurrencies
- Stocks and Shares
- Commodities
- Indices
How the Multi Chart Multi Timeframe Indicator Operates
This indicator is designed to identify bullish and bearish market trends by comparing price behavior across several selected timeframes.
When price action shows consistent alignment between lower and higher timeframes, the likelihood of a strong and sustainable trend increases. Conversely, conflicting signals across timeframes may indicate:
- Trend weakening or exhaustion
- Market consolidation phases
- Potential reversal areas
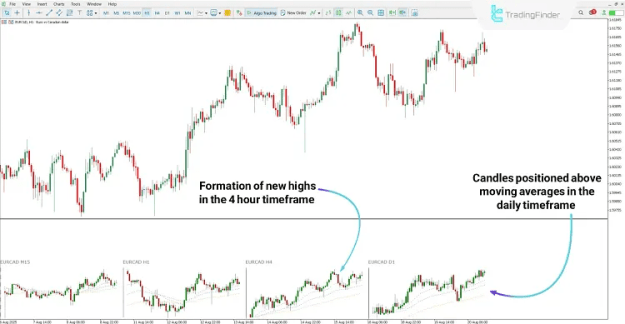
Bullish Trend Identification
A bullish market structure is confirmed when price action remains consistently above short-term, mid-term, and long-term moving averages across all configured timeframes.
Under these conditions:
- Higher highs and higher lows are maintained
- Trend continuation probability increases
- Long-position trade setups become more reliable
This multi-timeframe alignment reflects strong buying pressure and sustained upward momentum.
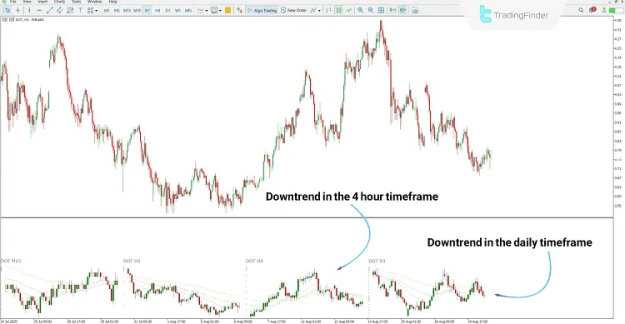
Bearish Trend Identification
A bearish trend is identified when price remains below the moving averages across both lower and higher timeframes.
In such market conditions:
- Lower highs and lower lows prevail
- Selling pressure dominates market activity
- Short-position trade opportunities gain higher probability
This configuration is particularly effective for detecting extended downtrends, especially in highly volatile markets such as cryptocurrencies.
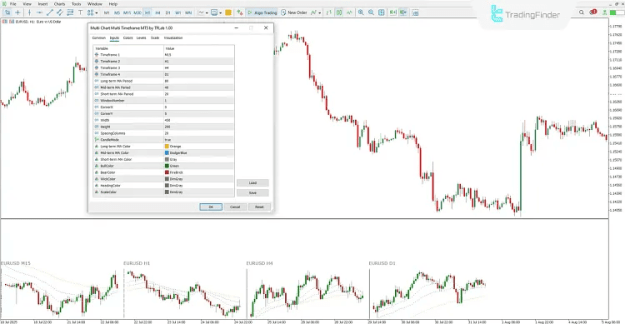
Multi Chart Multi Timeframe Indicator Settings
The indicator provides a wide range of customization options, enabling traders to tailor its behavior and appearance to their individual strategies and display preferences.
Timeframe Configuration
- Timeframe 1: Primary analysis timeframe
- Timeframe 2: Secondary confirmation timeframe
- Timeframe 3: Additional validation timeframe
- Timeframe 4: Higher-timeframe market overview
Moving Average Parameters
- Long-term Moving Average period
- Mid-term Moving Average period
- Short-term Moving Average period
Display and Layout Options
- Indicator window number selection
- Horizontal and vertical positioning
- Adjustable width and height
- Spacing between mini chart columns
- Candlestick display mode
Color Customization Options
- Long-term MA color
- Mid-term MA color
- Short-term MA color
- Bullish candle color
- Bearish candle color
- Wick color
- Timeframe title color
- Axis and scale color
Note:
For proper operation, the required font must be installed before using the indicator. The font file is included in the installation package.
Conclusion
The Multi Chart Multi Timeframe Indicator for MT5 offers a comprehensive and efficient solution for traders who require clear multi-timeframe market insight without compromising chart simplicity.
By integrating synchronized chart views with short-term, mid-term, and long-term moving averages, this indicator enhances trend analysis precision and supports more confident trading decisions across various markets and trading styles.
This tool is particularly valuable for traders seeking a structured and disciplined approach to trend confirmation and overall market context analysis